The Relationship Between Various Left Ventricular Geometries and the Cardio Ankle Vascular Index
Received Date: March 19, 2020 Accepted Date:April 11, 2020Published Date: April 14, 2020
doi: 10.17303/jcvm.2020.6.201
Citation:Kazuhiro Shimizu (2020) The Relationship Between Various Left Ventricular Geometries and the Cardio Ankle Vascular Index.J Cardio Vasc Med 8: 1-11.
Abstract
Objectives: Arterial stiffness was supposed to be involved in the formation of left ventricular geometry, but the precise was not fully elucidated. The present study investigated the relationship between various left ventricular geometric patterns and the cardio ankle vascular index (CAVI) among patients with metabolic disorders.
Methods: Patients (n=1046) with some of the risks like metabolic disorders such as diabetes mellitus, hypertension, and dyslipidemia were enrolled. Based on the relative wall thickness (RWT) and the left ventricular mass index (LVMI) by echocardiography, the patients were divided into 4 patterns of left ventricular geometry: normal geometry (NG, n=157), concentric remodeling (CR, n=435), concentric hypertrophy (CH, n=412) and eccentric hypertrophy (EH, n=42). Left ventricular ejection fraction (EF), early diastolic mitral annular velocity (e’) were examined by echocardiography. CAVI was measured using Vasela 1500.
Results: Gender, age, and body weight were almost equal in the 4 groups. Systolic and diastolic BP were significantly higher in the order of NG, CR and CH (127/76, 134/81 and 143/84mmHg, p< 0.001, respectively). CAVI was higher in the order of NG, CR and CH (8.7, 9.3 and 9.4, p< 0.001, p< 0.05, respectively). In contrast, both BP and CAVI were not higher in EH compared to CH (131/78 to 143/84, p< 0.001 and 8.8 to 9.4, p< 0.05). EF was decreased slightly in CH and the lowest in EH.e’ was the lowest in CH. In the NG, CR and CH groups, CAVI was a significant factor for RWT independently of systolic blood pressure (β 0.152 P< 0.001) and in the NG and EH groups, CAVI was the only contributing factor for RWT (β 0.187 P< 0.01).
Conclusions: For the formation of left ventricular geometries, CR and CH could be influenced by BP and CAVI, whereas EH might be more related to myocardium dysfunction itself.
Keywords: Left Ventricular Geometry; Left Ventricular Mass Index; Arterial Stiffness; Cardio Ankle Vascular Index; Hypertension
Introduction
Left ventricular hypertrophy (LVH) is well known as a risk for cardiovascular disease [1,2]. Currently, the formula for chamber quantification of left ventricular (LV) geometry recommended by the American Society of Echocardiography (ASE) has been proposed [3,4]. LV geometry correlates the relative wall thickness (RWT) and the mass (hypertrophy), which explains the relationship between wall thickness and cavity size [5]. Using these two features, LV geometry could be classified as follows: normal geometry, concentric remodeling, concentric hypertrophy and eccentric hypertrophy [6,7]. Furthermore, the Framingham study reported that subjects with concentric hypertrophy have the worst prognosis, followed by eccentric hypertrophy, concentric remodeling and normal geometry [8]. As for the mechanism and contribution factors for LV geometry, the degree and the duration of hypertension are known to be very important factors; arterial stiffness is also thought to be important as an afterload of the heart. In the past, arterial stiffness had been measured using pulse wave velocity (PWV), such as carotid-femoral pulse wave velocity (cfPWV). However, PWV is intrinsically dependent on blood pressure (BP) at the measuring time [9-11]. Therefore, it is difficult to evaluate the role of arterial stiffness measured with PWV in LV remodeling.
Recently, the cardio-ankle vascular index (CAVI) was developed as an indicator of arterial stiffness from the origin of the aorta to the ankle [12]. The feature of CAVI is its independency from blood pressure at the time of measurement [13, 14]. As a marker of arterial diastolic-to-systolic stiffening, CAVI may be suitable to assess the arterial stiffness. Several papers have reported the importance of CAVI in the formation of left ventricle remodeling [11,15-17]. However, the precise role of CAVI in the formation of various types of LV geometry has not been fully clarified.
Methods
Subjects
In this retrospective observational study, patients (n=1046) with some of the risks like metabolic disorders (diabetes mellitus (DM), hypertension (HT) and dyslipidemia (DL)), who visited our hospital from 2007 to 2017 were enrolled. DM was defined as glycated hemoglobin (HbA1c) concentration of ≥6.5% (according to the National Glycohemoglobin Standardization Program) or the presence of antidiabetic treatment. HT was defined as a systolic BP of ≥140 mm Hg and/or a diastolic BP of ≥90 mm Hg or presence of antihypertensive treatment. DL was defined as a low-density lipoprotein cholesterol level of ≥140 mg/dL, a high-density lipoprotein cholesterol level of < 40 mg/dL or a triglyceride level of ≥150 mg/dL or the presence of antihyperlipidemic treatment. Exclusion criteria were as follows: acute myocardial infarction, acute myocarditis, open-heart surgery, atrial fibrillation, severe obesity (body mass index >35), atherosclerosis obliterans (ankle-brachial index < 0.9) and more than moderate valvular stenosis or regurgitation. There were 159 (15%) subjects with cerebrovascular disease (CVD) and 326 (31%) with coronary artery disease (CAD). Examination of CAVI and echocardiography were performed at the same time.
Echocardiography measurement
The GE Vivid7, E9, S5 and S6 Ultrasound System (GE Healthcare, Boston, MA) were used for two-dimensional, M-mode, and color Doppler echocardiography. LV end-systolic and diastolic dimensions (LVEDD), septal and posterior wall thickness, LV ejection fraction (EF), and diastolic function were measured according to the American Society of Echocardiography (ASE) guidelines [3,4]. The average of the peak mitral annular systolic (s’) and early diastolic velocity (e’) at the medial and lateral walls was used to estimate LV systolic function and early diastolic relaxation using tissue Doppler imaging. The ratio of early transmitral flow filling velocity (E) to e’ (E/e’) was used to estimate LV filling. LV mass (LVM) was calculated from the simplified cubed equation formula and indexed to body surface area. Relative wall thickness (RWT) was used as a surrogate of LV concentric geometry and calculated from the sum of LV septal and posterior wall thickness divided by LV internal dimension at the end of diastole.
LVM was calculated using the ASE formula: 0.8∙(1.04∙ ((IVSD+LVEDD+PWTD)3-(LVEDD)3)) +0.6. The left ventricular mass index (LVMI) was calculated as LVM/body surface area. LVH was defined as increased LVMI (≥96 g/m2 in females; ≥116 g/m2 in males). Normal LVMI was defined as < 96 g/m2 in females and < 116 g/m2 in males. RWT was calculated using the ASE formula: RWT = 2∙ posterior wall thickness in diastole/left ventricular internal dimension in diastole. Increased RWT was defined as RWT >0.42, and normal RWT was defined as RWT ≤0.42. Based on the measured values, all patients were classified into the following 4 groups according to the ASE guidelines: normal geometry (NG; normal LVMI and normal RWT), concentric remodeling (CR; normal LVMI and increased RWT), concentric hypertrophy (CH; increased LVMI and increased RWT) and eccentric hypertrophy (EH; increased LVMI and normal RWT). All measurements were performed by trained sonographers and confirmed to these results by cardiologists.
CAVI Measurements
All measurements were conducted in a quiet room kept at a constant temperature. CAVI was measured using the vascular screening system, VaSera1500 (Fukuda Denshi Co., Ltd., Tokyo, Japan). The methods were described previously [12,14]. Briefly, cuffs were applied to bilateral upper arms and ankles, with the subject supine and the head held in the midline position. Examinations were performed after resting for 10 min. To detect brachial and ankle pulse waves with cuffs, a low cuff pressure of 30–50 mmHg was used to ensure the minimal effect of cuff pressure on hemodynamics. BP was measured thereafter.
CAVI was determined by the following equation: CAVI = a{(2p/ΔP) × ln (Ps/Pd) PWV2} + b,
Where Ps and Pd are systolic and diastolic BP, respectively, PWV is pulse wave velocity from the origin of the aorta to the junction of the tibial artery with the femoral artery, ΔP is Ps-Pd, p is blood density, and a and b are constants. The equation is derived from Bramwell-Hill’s equation and the stiffness parameter β, and CAVI was adjusted for BP based on the stiffness parameter β. We used the right CAVI value for this study.
BP and Heart Rate Measurements
BP and heart rate (HR) were measured at the time of CAVI measurement by VaSera1500.Examinations were performed after resting for 10 min. We used the right upper arm blood pressure for this study.
Statistical Analyses
Continuous variables were expressed as mean ± standard deviation for normally distributed variables and median (IQR) for skewed distributed variables. The continuous variables were evaluated for statistical significance by ANOVA and post-hoc tests. Tukey-Kramer test was used for post-hoc analysis. Categorical variables were assessed by the chi-squared test. The correlation between RWT or LVMI and each parameter was evaluated using Spearman`s correlations. Variables with p values < 0.05 on univariate analysis were entered into a multiple regression analysis using a forward stepwise algorithm. All statistical analysis was double-sided. Statistical analysis was performed using the SPSS software package (PASW Statistics 18, Chicago, IL, USA). P-value of < 0.05 was considered statistically significant.
Ethics
This retrospective observational study was approved by the Ethics Committee of Toho University Sakura Medical Center (S17097). Informed consent was obtained in the form of opt-out on the website.
Results
Clinical features of the 4 groups of patients with various left ventricle geometric patterns
The patients (n=1046) were divided into four groups: normal geometry (NG, n=157), concentric remodeling (CR, n=435), concentric hypertrophy (CH, n=412) and eccentric hypertrophy (EH, n=42).
Table 1 shows the backgrounds of patients. Gender, age, and body weight were almost equal and non-significant differences among the 4 groups.
Plasma brain natriuretic peptide (BNP) values were as follows; NG: 22.5pg/ml (9.9, 42.9), CR: 28.5pg/ml (13.2, 51.0), CH: 72.1pg/ml (30.6, 212.7), and EH: 144.0pg/ml (54.3, 717.6), respectively. Significant changes were not observed among NG and CR. CH was high compared to CR (p< 0.001). EH was the highest among the four groups (NG to EH, P< 0.001, CR to EH, P< 0.001, CH to EH, P< 0.001).
Blood pressure, CAVI, ejection fraction and e’ in 4 groups of left ventricular geometries
As shown in Figure1, systolic BP (SBP) and diastolic BP (DBP) were significantly higher in the order of NG, CR, and CH, respectively. Arterial stiffness evaluated by CAVI was higher in CR and CH than in NG. In contrast, BP and CAVI were not higher in EH compared to CH (SBP; 131 to 143, p< 0.001. DBP; 78 to 84, p< 0.001. CAVI; 8.8 to 9.4, p< 0.05). These results suggested that hypertension and high CAVI might be involved in the formation of CR and CH.
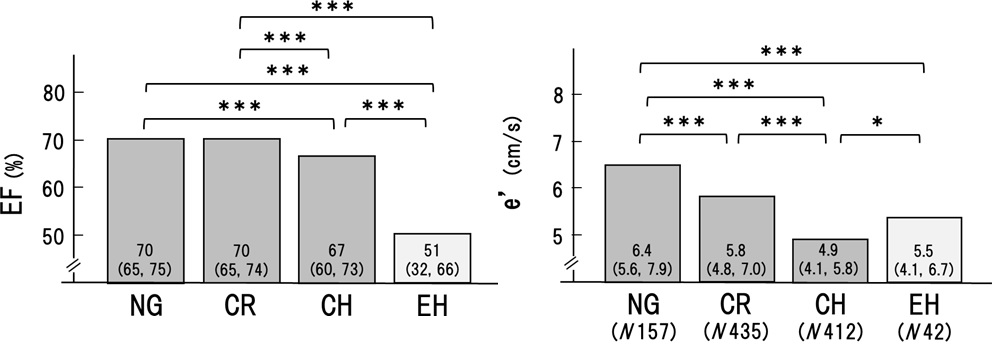
Next, cardiac functions were compared among the 4 groups. As shown in Figure 2, the ejection fraction was maintained in NG and CR, but decreased significantly in CH, and decreased further in EH. On the other hand, é decreased significantly in the order of NG, CR, and CH. However, this trend was not recognized in EH. These results suggested that CR and CH were related to heart failure with reduced ejection fraction and preserved ejection fraction, whereas, EH was mainly related to heart failure with reduced ejection fraction.
Those results might suggest that CR and CH were apparently the same series of LV remodeling, whereas EH was seemed to be another continuum as shown in Figures 1 and 2. Therefore, to determine the precise contributing factors for RWT and LVMI, the background factors in NG, CR, and CH groups and those in NG and EH groups were separately analyzed. Age, BMI, HR, SBP, DBP, Cre, TC, TG, LDL, HDL, and CAVI were investigated in the next.
The correlations between RWT and various parameters in NG, CR and CH groups
(Table 2A) shows the correlations between RWT and various parameters in NG, CR, and CH groups. RWT had a positive correlation with age, BMI, HR, SBP, DBP, Cre, TG, LDL and CAVI. HDL had a negative correlation with RWT. By the multiple regression analysis, HR, SBP, Cre, LDL, HDL, and CAVI were significant factors for RWT.
The correlations between RWT and various parameters in NG, and EH groups
(Table 2B) showed that CAVI was a contributing factor for RWT among NG and EH groups. RWT had a positive correlation with Age and CAVI. By the multiple regression analysis, CAVI was a significant factor for RWT.
The correlations between LVMI and various parameters in NG, CR and CH groups
(Table 3A) shows the correlations between LVMI and each parameter in NG, CR and CH groups. LVMI had a positive correlation with BMI, SBP, DBP, Cre, and CAVI. TC and HDL showed a negative correlation. By the multiple regression analysis, SBP, Cre, HDL, and CAVI were significant factors for LVMI among NG, CR and CH groups.
The correlations between LVMI and various parameters in NG and EH groups
(Table 3B) shows the correlations between LVMI and various parameters in NG and EH groups. LVMI had a positive correlation with BMI, Cre, and TC. HDL had a negative correlation. The multiple regression analysis showed that Cre and SBP were significant factors for LVMI in this group, but CAVI was not significant.
Discussion
The cardiac geometry has been classified into four sections according to the relative wall thickness (RWT) and the left ventricular mass index (LVMI) [3,4]. In the present study, patients (n=1046) with some of the risks like metabolic disorders such as diabetes mellitus, hypertension, and dyslipidemia were enrolled. Based on RWT and LVMI, the patients were divided into 4 patterns of left ventricular geometry: normal geometry (NG, n=157), concentric remodeling (CR, n=435), concentric hypertrophy (CH, n=412) and eccentric hypertrophy (EH, n=42). Gender, age, and body weight were almost equal in the 4 groups. As shown in Figures 1 and 2, systolic and diastolic BP were significantly higher in the order of NG, CR, and CH. CAVI was higher in the order of NG, CR, and CH. In contrast, both BP and CAVI were not higher in EH compared to CH. EF was decreased slightly in CH and the lowest in EH. e' was the lowest in CH. From these results, as shown in figure 3, we hypothesized that CR and CH were the same series of LV remodeling, whereas EH was seemed to be another continuum. Furthermore, to determine the precise contributing factors for RWT and LVMI, the background factors in NG, CR, and CH groups and those in NG and EH groups were separately analyzed. The reason why NG was included in both groups, the significances of various contributing factors for CR, CH and EH would become much clear by including NG group.
In a multiple regression analysis, CAVI was a significant factor for RWT in the NG, CR and CH groups (β 0.152, P< 0.001) in addition to HR, SBP, Cre, LDL, and HDL. In NG and EH groups, CAVI was the only significant factor (β 0.187, P< 0.01).As for LVMI, multiple regression analysis showed that CAVI was the significant factor in the NG, CR and CH groups (β 0.068, P< 0.05), but was not in the NG and EH groups.
These results supported the idea that CR and CH were apparently the same series of LV remodeling associating with RWT and LVMI mainly affected by systolic blood pressure and arterial stiffness measured as CAVI. CAVI reflected the arterial stiffness from the origin of the aorta to the ankle and might work as afterload for the left ventricle. In the case of heart failure, Ohira reported that CAVI was negatively correlated with left ventricular ejection fraction (EF) in patients with heart failure [18]. And, after treatment of heart failure, improvement of EF was correlated significantly with a decrease in CAVI. These results might be consistent with the idea that CAVI could play an afterload for the left ventricle, and adversely affect EF during heart failure. This observation is essentially consistent with our findings that CAVI is high and EF is low in CH comparing with those in NG. Furthermore, recently, left atrial reservoir function has been reported to be inversely correlated with CAVI in a community-based cohort [19]. Since reduced left atrial reservoir function was brought by left ventricle overload which was also affected by CAVI as afterload of the left ventricle. Thus, an inverse correlation between left atrial reservoir function and CAVI might be also consistent with high CAVI observed in CR and CH in our present study.
Whereas EH was affected less by blood pressure and arterial stiffness measured as CAVI, RWT in EH was related with CAVI, but LVMI in EH was not related with CAVI. These results suggested that EH formation was not influenced by afterload for the left ventricle. BNP in EH was the highest among 4 geometries. One of the causes of low CAVI might be attributed to high BNP, because BNP is known to decrease vascular resistance, causing arterial dilation and leading to reduced blood pressure and ventricular afterload [20,21]. BNP also has relaxing effects on the myocardium [22,23].
From these results, it was speculated that formations of myocardial geometries could be divided into two types: one is associated with high BP and high CAVI (indicating a high afterload), accompanied by atherosclerosis risk factors such as obesity [24,25], HT [26,27], chronic kidney disease [28,29] and low HDL [30]. The other type is caused by myocardium disorder itself associated with relatively low BP and low CAVI. Considering those results, EH formation might not be far advanced form from CH, but, it might be formed due to cardiovascular dysfunction itself. Another hypothesis was mentioned as follows; EH would be far beyond the CH, accompanying decreased ejection fraction. And this decreased ejection fraction might induce a decrease of arterial stiffness as compensation of decreased ejection fraction by accompanying with secreting BNP. But there was not enough evidence to support the later hypothesis. Further studies were required to clarify the process and mechanism of how four geometries were formed.
Study limitations
First, this study is a cross-sectional survey, and therefore, a longitudinal investigation is necessary to prove factors affecting the change of LVMI. Second, the numbers of EH patients were very small compared to CR and CH patients. Precise observations are needed in the clinical course of the EH patient. Thirds, this study was performed by only a single center. Fourth, the examination was performed under regular daily medications.
Conclusion
It is suggested that the additional assessment of CAVI to LV geometric patterns using echocardiographic studies would facilitate differentiation of the geometries and contribute a deep understanding of cardiovascular diseases. BP and CAVI might be involved in the formation of CR and CH, whereas EH might be caused by the myocardium disorder itself. Further studies were required to clarify the mechanism of how four geometries were formed.
Acknowledgments
We appreciated the clinical physiology staff: Hashiba K, Morinaga Y, Tanji N, Takahashi N, Sugiyama M, Takahashi O, KonT, Takiguchi M, Shimizu A, Ogawa T, Kurosu T, Suzuki J, Tomaru T and Takada N. And we also appreciated the cardiology staff: Todani S, Itoh T, Iwakawa A, Sugizaki Y, Kawazoe M, Noike H, and Tomaru T.
- Dzau VJ, Antman EM, Black HR, Hayes DL, Manson JE, Plutzky J, et al. (2006) The cardiovascular disease continuum validated: clinical evidence of improved patient outcomes: part I: Pathophysiology and clinical trial evidence (risk factors through stable coronary artery disease). Circulation 114: 2850-2870.
- Muresan ML, Salvetti M, Monteduro C, Bonzi B, Paini A, Viola S, et al. (2004) Left ventricular concentric geometry during treatment adversely affects cardiovascular prognosis in hypertensive patients. Hypertension 43: 731–738.
- Lang RM, Bierig M, Devereux RB, Flachskampf FA, Foster E, Pellikka PA, et al. (2005) Chamber Quantification Writing Group; American Society of Echocardiography’s Guidelines and Standards Committee; European Association of Echocardiography. Recommendations for chamber quantification: A report from the American Society of Echocardiography's Guidelines and Standards Committee and the Chamber Quantification Writing Group, developed in conjunction with the European Association of Echocardiography, a branch of the European Society of Cardiology. J Am Soc Echocardiogr 18: 1440–1463.
- Lang RM, Badano LP, Mor-Avi V, Afilalo J, Armstrong A, Ernande L, et al. (2015) Recommendations for cardiac chamber quantification by echocardiography in adults: an update from the American Society of Echocardiography and the European Association of Cardiovascular Imaging. J Am Soc Echocardiogr 28: 1–39.e14.
- Devereux RB, Roman MJ (1999) Left ventricular hypertrophy in hypertension: Stimuli, patterns, and consequences. Hypertens Res 22: 1–9.
- Koren MJ, Devereux RB, Casale PN, Savage DD, Laragh JH (1991) Relation of left ventricular mass and geometry to morbidity and mortality in uncomplicated essential hypertension. Ann Intern Med 114: 345–352.
- Ganau A, Devereux RB, Roman MJ, de Simone G, Pickering TG, Saba PS, et al. (1992) Patterns of left ventricular hypertrophy and geometric remodeling in essential hypertension. J Am Coll Cardiol 19:1550–1558.
- Krumholz HM, Larson M, Levy D (1995) Prognosis of left ventricular geometric patterns in the Framingham Heart Study. J Am Coll Cardiol 25: 879-884.
- Cecelja M, Chowienczyk P (2009) Dissociation of aortic pulse wave velocity with risk factors for cardiovascular disease other than hypertension: a systematic review. Hypertension 54: 1328–1336.
- Schillaci G, Pucci G, Pirro M, Settimi L, Hijazi R, Franklin SS, Mannarino E (2011) Combined effects of office and 24-hour blood pressure on aortic stiffness in human hypertension. J Hypertens 9: 869–875.
- Schillaci G, Battista F, Settimi L, Anastasio F, Pucci G (2015) Cardio-ankle vascular index and subclinical heart disease. Hypertens Res 38: 68–73.
- Shirai K, Utino J, Otsuka K, Takata M (2006) A noble blood pressure-independent arterial wall stiffness parameter; cardio-ankle vascular index (CAVI). J Atheroscler Thromb 13:101-107.
- Shirai K, Song M, Suzuki J, Kurosu T, Oyama T, Nagayama D, et al. (2011) Contradictory effects of β1-and α1-adrenergic receptor blockers on cardio-ankle vascular stiffness index (CAVI)–CAVI is independent of blood pressure. J Atheroscler Thromb 18: 49-55.
- Hayashi K, Yamamoto T, Takahara A, Shirai K (2015) Clinical assessment of arterial stiffness with cardio-ankle vascular index: theory and applications. J Hypertens 33: 1742-1757.
- Namba T, Masaki N, Matsuo Y, Sato A, Kimura T, Horii S, et al. (2016) Arterial stiffness is significantly associated with left ventricular diastolic dysfunction in patients with cardiovascular disease. Int Heart J 57: 729-735.
- Ye Z, Pellikka PA, Kullo IJ (2017) Sex differences in associations of the cardio-ankle vascular index with left ventricular function and geometry. Vasc Med 22: 465-472.
- Shimizu K, Tabata T, Kiyokawa H, Morinaga Y, Sato S, Mikamo H, et al. (2019) A Case Demonstrating the Cardio-Vascular Interaction by a New Cardio-Ankle Vascular Index During the Treatment of Concentric Hypertrophy. Cardiol Res 10: 54-58.
- Zhang C, Ohira M, Tomaru T, WANG H, Noike H, Shirai K, et al. (2013) Cardio-ankle vascular index relates to left ventricular ejection fraction in patients with heart failure. A retrospective study. Int Heart J 54: 216-221.
- Yoshida Y, Nakanishi K, Daimon M, Ishiwata J, Homma S, Komuro I et al. (2020) Association of arterial stiffness with left atrial structure and phasic function: a community-based cohort study. J Hypertens.
- Richards AM, McDonald D, Fitzpatrick MA, Nicholls MG, Espiner EA, Ikram H, et al. (1998) Atrial natriuretic hormone has biological effects in man at physiological plasma concentrations. J Clin Endocrinol Metab 67: 1134–1139.
- Tonolo G, Richards AM, Manunta P, Troffa C, Pazzola A, Madeddu P, et al. (1989) Low-dose infusion of an atrial natriuretic factor in mild essential hypertension. Circulation 80: 893–902.
- Clarkson PB, Wheeldon NM, Macleod C, Coutie W, Mac- Donald TM (1995) Brain natriuretic peptide: effect on left ventricular filling patterns in healthy subjects. Clin Sci (Colch) 88: 159–64.
- de Lemos JA, McGuire DK, Drazner MH (2003) The B-type natriuretic peptide in cardiovascular disease. Lancet 362: 316–22.
- Nagayama D, Endo K, Ohira M, Yamaguchi T, Ban N, Kawana H, et al. (2011) Effects of body weight reduction on the cardio- ankle vascular index (CAVI). Obes Res Clin Pract 7: e139– e145.
- Satoh-Asahara N, Kotani K, Yamakage H, Yamada T, Araki R, Okajima T, et al (2015) Japan Obesity and Metabolic Syndrome Study (JOMS) Group. Cardio-ankle vascular index predicts the incidence of cardiovascular events in obese patients: a multicenter prospective cohort study (Japan Obesity and Metabolic Syndrome Study: JOMS). Atherosclerosis 242: 461-468.
- Wen W, Luo R, Tang X, Tang L, Huang HX, Wen X, et al. (2015) Age-related progression of arterial stiffness and its elevated positive association with blood pressure in healthy people. Atherosclerosis 238: 147-152.
- Wen W, Luo R, Tang X, Tang L, Huang HX, Wen X, et al. (2015) Age-related progression of arterial stiffness and its elevated positive association with blood pressure in healthy people. Atherosclerosis 238: 147-152.
- Nakamura K, Iiduka T, Takahashi M, Shimizu K, Mikamo H, Nakagami T, et al. (2009) Association between cardio ankle vascular index and serum cystatin C levels in patients with the cardiovascular risk factor. J Atheroscler Thromb 16: 371-379
- Hitsumoto T (2018) Clinical Usefulness of the Cardio-Ankle Vascular Index as a Predictor of Primary Cardiovascular Events in Patients with Chronic Kidney Disease. J Clin Med Res 10: 883- 890.
- Nagayama D, Watanabe Y, Saiki A, Shirai K, Tatsuno I (2018) Lipid Parameters are Independently Associated with Cardio-Ankle Vascular Index (CAVI) in Healthy Japanese Subjects. J Atheroscler Thromb 25: 621-633.
FIGURE 1
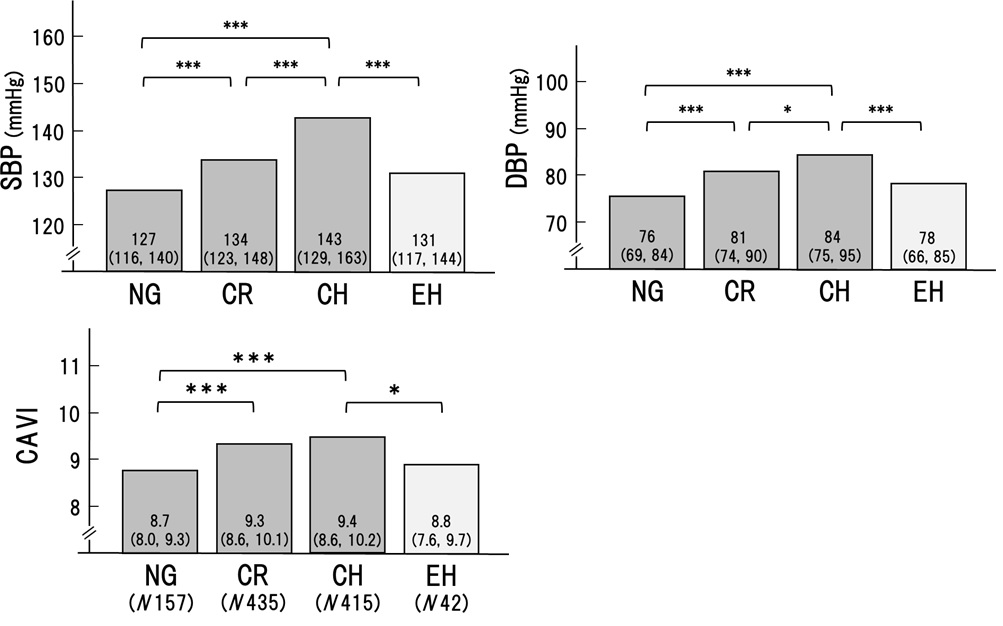
Figure 1. Blood pressure and CAVI in the 4 groups of left ventricular geometry patterns.
Values are median (interquartile range).
Abbreviations: SBP, systolic blood pressure; DBP, diastolic blood pressure; CAVI, cardio-ankle vascular index; NG, normal geometry; CR, concentric remodeling; CH, concentric hypertrophy; EH, eccentric hypertrophy.
FIGURE 2
Figure 2. Ejection fraction and e� in the 4 groups of left ventricular geometry patterns.
Values are median (interquartile range).
Abbreviations: EF, ejection fraction.
FIGURE 3
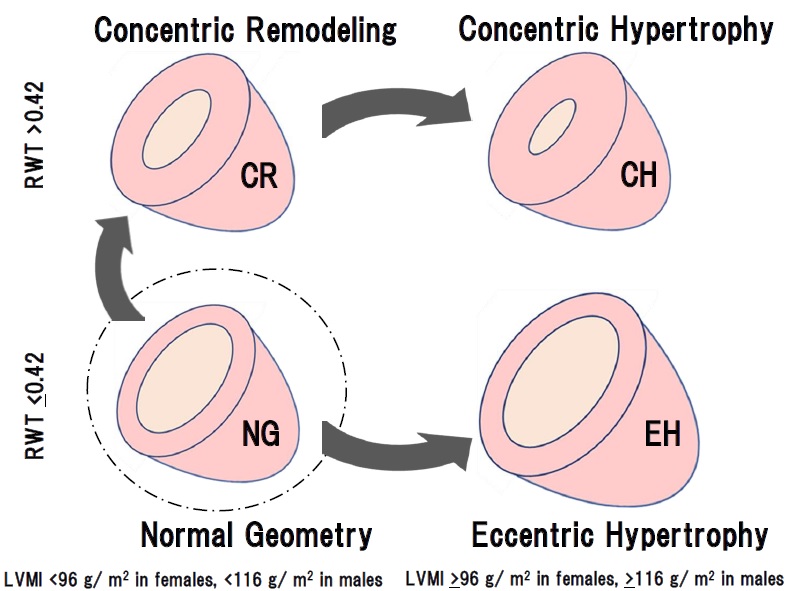
Figure 3.The two continuums in the left ventricular geometries Abbreviations: RWT, relative wall thickness; LVMI, left ventricular mass index.
Tables at a glance
Figures at a glance