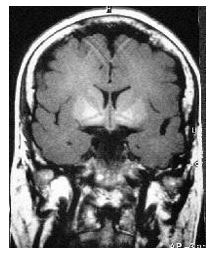
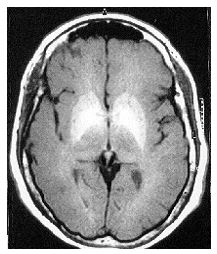
Figure 1: a) Axial, and b) Coronal T1-weighted magnetic resonance imaging of the brain showing basal ganglia hyperintensities, more marked in globus pallidus, caudate nucleus and mesencephalon in a patient with chronic hepatic encephalopathy
Figure 1: a) Axial, and b) Coronal T1-weighted magnetic resonance imaging of the brain showing basal ganglia hyperintensities, more marked in globus pallidus, caudate nucleus and mesencephalon in a patient with chronic hepatic encephalopathy
Tables at a glance
Figures at a glance