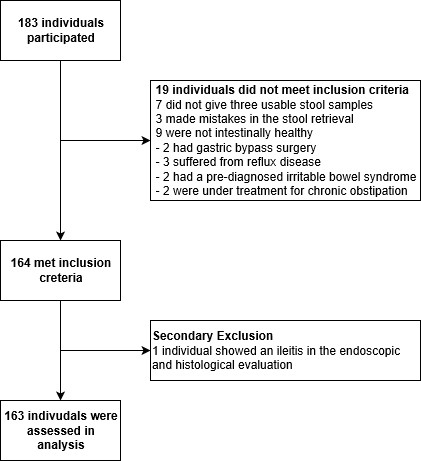
Figure 1: Flow chart
Figure 1: Flow chart
Abbreviations: Cal: faecal calprotectin (FC) in μg/g; cal1-3: results of the first through third FC measurement. Rep: red represents the second,
blue the third measurement.
How to read the table: the x-axis shows the first calprotectin measurement (Cal1), red on the y-axis shows the second measurement (cal2),
blue on the y-axis the third (cal3). 6 values (from 6 different volunteers) > 400 μg/g were not documented for better visibility: 587 and 489 in
the first measurement, 2142 and 728 in the second, and 699 and 485 in the third measurement.
Figure 2: Faecal Calprotectin measurements per volunteer

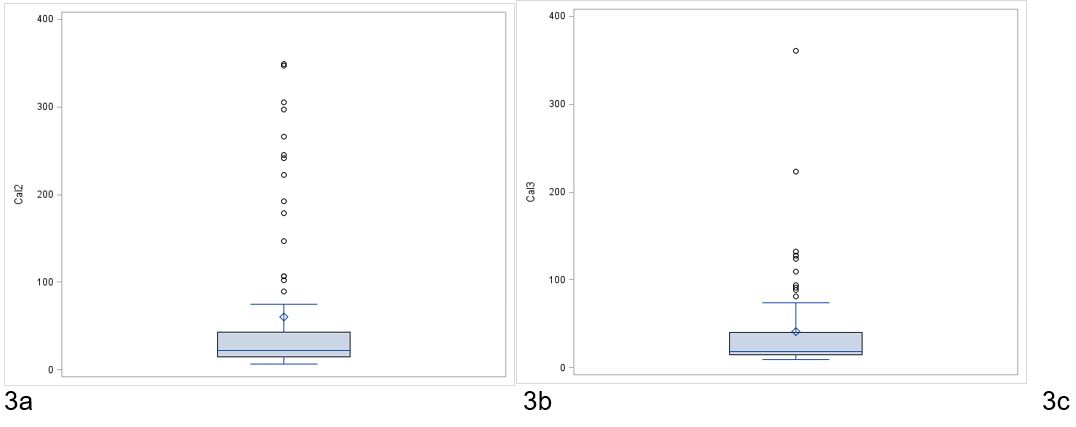
Feacal calprotectin in μg/g. The box plots show median and interquartile range, mean (small square) and standard deviation, as well as
outliers. 6 values (from 6 volunteers) > 400 μg/g were not documented for better visibility: 587 and 489 μg/g in the first measurement, 2142
and 728 μg/g in the second, and 699 and 485 μg/g in the third measurement.
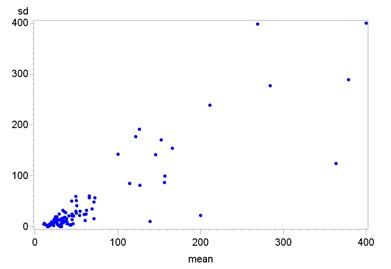
Figure 3: Boxplots of the first (a), second (b) and third (c) calprotectin measurement
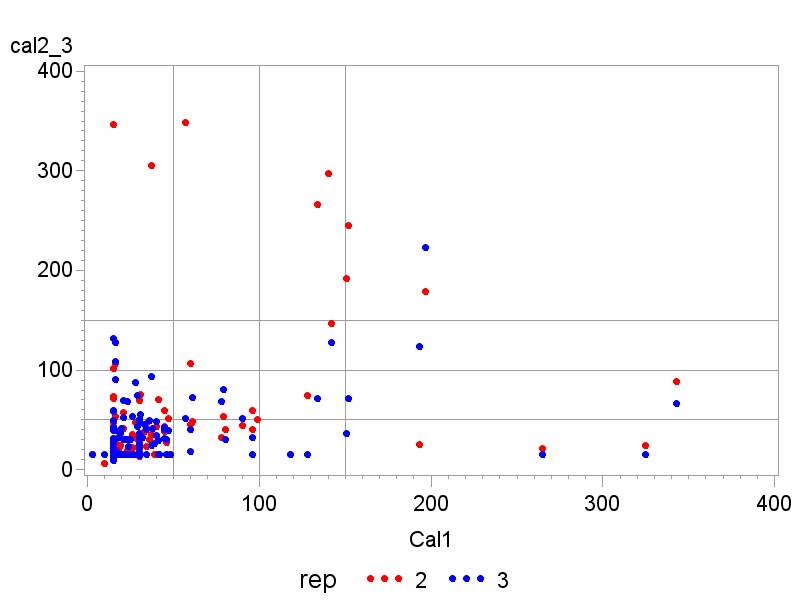
Figure of calprotectin values (μg/g) of 163 volunteers; sd: standard deviation
Supplementary Figure 1: Range comparison
Tables at a glance
Figures at a glance