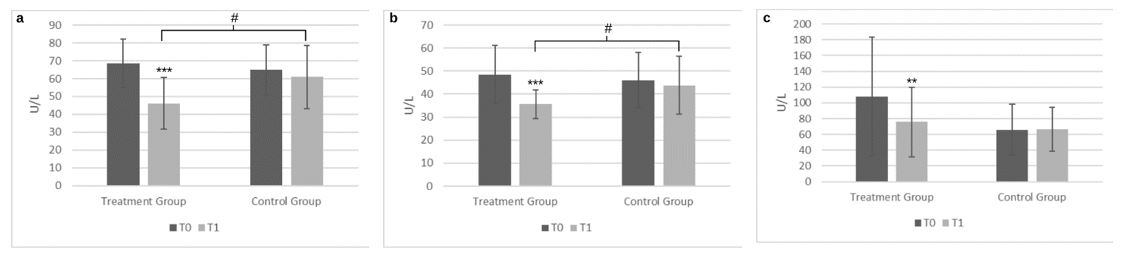
Figure 1: Liver enzymes levels change from baseline to post-intervention in treatment and control groups
Reduction of liver enzymes levels from baseline to post-intervention in treatment and control groups. Dark column represents the enzymes levels at the baseline and light column the enzymes levels after 4-months of the food supplements plus diet or only diet, respectively. All data are presented as mean ± SD. a) shows alanine aminotransferase (ALT) levels, b) aspartate aminotransferase (AST) levels and c) gamma-glutamyl transferase (GGT) levels within-group changes from baseline to post-intervention. * p-value T0 vs T1; # p-value T1 vs T1.
Tables at a glance
Figures at a glance