Intra-Individual Variability of Faecal Calprotectin in Intestinally Healthy Individuals
Received Date: February 07, 2023 Accepted Date: February 07, 2023 Published Date: February 10, 2023
doi: 10.17303/aglp.2023.3.102
Citation: Seraina Netzer, Peter Netzer (2023) Intra-Individual Variability of Faecal Calprotectin in Intestinally Healthy Individuals. J Ann Gastroenterol Liver Pancreatic Dis 3: 1-15
Abstract
Objectives: Faecal Calprotectin (FC) is a marker for intestinal inflammation, which allows the clinician to distinguish between functional and organic intestinal illnesses, as well as to evaluate the activeness of disease in chronic inflammatory bowel syndrome (IBD). This is done with one measurement in one stool sample. There are rare studies that report day-today variability in FC concentration measured in patients with IBD. If such variability also exists in healthy individuals has not been investigated so far.
Aim: To determine the day-to-day variability of FC in healthy individuals.
Methods: 163 healthy volunteers without gastrointestinal symptoms gave three stool samples of the morning bowel movement mostly within 3 days. The FC-analysis was made by enzyme-linked immunosorbent essay (ELISA) method after Bühlmann. The threshold to pathological FC- values was 50μg/g.
Results: Of the 163 volunteers (aged 17-66y, mean 37y, 100 women), 49 volunteers (30.1%) showed at least one value deemed pathologic. 40 (24.5%) showed both normal and elevated (>50μg/g) values and 9 (5.5%) showed elevated values throughout. Applying a cut-off of 100 μg/g, 26 volunteers (16%) showed at least one elevated measurement and only 4 (2.5%) had values consistently over 100 μg/g.
Conclusions: The presented data show a high variability of FC in a short amount of time in a third of the healthy volunteers. This suggests several measurements of FC to be adequate to reach a decision if further investigation is necessary.Raising the cut-off to 100 μg/g seems appropriate to keep the rate of false positive results low without missing relevant disease.
Keywords: Faecal Calprotectin; Variability; IBD
Study Highlights
What is Known
- Faecal calprotectin is a widely used marker for intestinal inflammation.
- Its main uses are in the management of inflammatory bowel disease and in distinguishing between organic and functional gastrointestinal disease.
- Clinical decisions are currently based on one stool sample.
- Faecal Calprotectin shows high variability even in intestinally healthy individuals.
- One measurement, as currently recom- mended, might well not be sufficient for reliable decision-making.
What is New Here
Introduction
Clinicians often have to assess abdominal dis- comfort, which presents the challenge of not only a large amount of possible diagnoses, but also simply differentiating between organic and functional disorders [1,2]. Evidently a thorough patient history and examination are crucial to finding the right diagnostic pathway, closely followed by laboratory testing [2]. An effective way to differentiate between functional and organic disorders of the gastro- intestinal tract is endoscopic exams [3]. These however are time consuming, expensive and disturbing to a lot of patients. Thus, faecal markers were researched. The best known faecal marker is calprotectin. Numerous studies have shown faecal calprotectin (FC) to be a useful tool to distinguish between functional and organic disorders [2,4,5]. It is decidedly more reliable than blood tests [6], therefore a slightly more uncomfortable means of collection and slightly higher effort to analyse seem justified. FC is a protein that is mainly found in neutrophil granulocytes [7]. Neutrophils are released in the gastrointestinal lumen by the inflamed intestinal mucosa and can thus be tracked in stool samples [7]. FC is very stable and resistant to intestinal bacteria, which leads to a generous time frame of analysis and uncomplicated storage, although it has been suggested, that a time period of three days should not be over stepped for an unbiased result [7].
FC is already widely used in the management of patients with inflammatory bowel disease (IBD), namely ulcerative colitis and Crohn’s disease [4]. Although FC cannot always accurately predict disease extension [8], it can premeditate a disease flare [9] and correlates well with mucosal healing, to date the most important prognostic factor in IBD [10]. It helps in the management of these patients, prevents unnecessary endoscopic exams and enables a timely start to therapy of a recurrence [4].
Less well established but getting better known is the role of FC in primary care [2,11,12]. Especially younger patients are more likely to suffer from irritable bowel syndrome (IBS) than IBD, although clinical presentation can be identical with bloating, discomfort, cramps etc [2]. A measurement of FC can help distinguish these two [2], Guidelines commonly recommend the measurement of FC in patients with unclear abdominal discomfort lasting longer than 4 weeks [14,15]. An FC value over 50µg/g would lead to an endoscopic exam; a value under this cut-off would determine a functional disorder, e.g. IBS, as the most likely diagnosis. It has indeed been thoroughly documented that FC has a high negative predictive value [16]. On the other hand, falsely positive results with this cut-off are common [5,12,16]. Several investigators have already recommended a cut-off of 100µg/g or higher because of this [2,10,12,17].
A further difficulty is the variability of FC, which has only been mentioned rarely and is little known. In scarce studies with IBD patients, high variability in FC values was shown [18-20]. In our own daily clinical practice we have seen this variability in a variety of patients. This poses the question if such variability also exists in healthy individuals. According to our knowledge, this has not been documented so far.
In this study, we planned to evaluate the changes in FC concentration intra-individually in a short amount of time. It was our objective to assess this variability in healthy individuals, as well as to see if we can see a benefit of several measurements instead of one. As a second objective, we examined the effects of elevating the currently used cut-off of FC.
Methods
For this study, healthy volunteers 17 years or older were recruited, who considered themselves intestinally healthy and were willing to give three stool samples on three consecutive days. Enrolment started in October 2015 and ended in February 2017, last follow-up was December 31st, 2019. Primary inclusion criteria where intestinally healthy volunteers, who submitted three stool samples on consecutive days. Exclusion criterion was an organic reason for FC elevation, including the use of NSAD. Interested parties received an information dossier and an interview for information and consent. They completed a short questionnaire to their overall health and gave their consent in writing. They then received three stool sample kits with verbal and written instructions on how and when to take the stool sample, namely from the morning stool of three consecutive days if possible, and to send in the stool samples the same day. Samples that were collected within 14 days were accepted for analysis, since analysis was not performed on weekends and not all participants had daily bowel movements. During the study period the volunteers were told not to take NSAID and to inform us about any changes in health. The volunteers with elevated values were further questioned by a doctor. Occult blood was evaluated as well. The stool samples were sent to MCL (Medizinische Chemische Laboratorien) in Niederwangen, CH. Occult Blood analysis was performed by MCL, the FC was analysed in cooperation with Rothen Medizinsche Laboratorien in Basel, CH. The Bühlmann Fcal ELISA Method was used to evaluate FC concentration in the stool [21]. This method was developed in Switzerland and has found worldwide recognition and use [22]. The cut-off used was 50 µg/g stool [15,21]. Results were often stated as <15 or <30 µg/g, which we coded as 15 and 30 µg/g respectively. When elevated values arose, we personally contacted the corresponding volunteers, informed them and completed a more thorough questioning to their overall and intestinal health at the time of participation. Then they were asked to participate a second time with another three stool samples. Further examinations were arranged or recommended according to constellation of results and clinical findings. In cases of elevated values endoscopic evaluation was recommended. Patients undergoing endoscopic evaluation received helicobacter pylori (H. pylori) antigen testing in either stool or histologic samples of their upper endoscopy [23]. Occult blood was initially determined through the guaiac test, oward the end of the study period MCL switched to immunchromatography [24]. Volunteers were informed in case of pathological results and recommendations were given. All results were seen by a medical doctor and pathological values were discussed in a team of doctors. All volunteers received a copy of their results. The values were transcribed encrypted in an excel chart. To a small extent, excel was used for the descriptive statistical analysis. The professor emeritus of Statistics of the University of Berne, Jürg Hüsler, received our encrypted patient data and calculated our statistical results with the Software SAS (Statistical Analysis System) Version 9.4. The study was approved by the Swiss Ethics committee of Berne (KEK-number 334/15).
Results
Study Population
Initially, we assessed 183 volunteers who considered themselves intestinally healthy. 163 of the 183 (89%) qualified for the final analysis (see also Figure 1). The 20 exclusions were as follows: 7 volunteers did not give three usable stool samples, 3 made mistakes in the stool retrieval, mostly taking all samples from the same stool. 9 had to be excluded because they revealed themselves to not being intestinally healthy after more thorough questioning, of these 2 had a gastric bypass surgery, 3 had reflux, 2 a diagnosed irritable bowel syndrome (IBS) and 2 were under treatment due to chronic obstipation. These 19 patients did not meet the inclusion criteria. Only one patient (0.5%) had to be excluded secondarily due to pathological endoscopic and histological findings, namely an ileitis of unknown origin. Of the 163 analysed volunteers 100 were women (61.3%) and 63 were men (36.7%). Median age was 26 years, mean age was 37 years, range was 17-66 years. Of the 163 volunteers analysed, 104 (63.8%), 138 (84.7%), 153 (93.9%) gave their stool samples on three consecutive days, within one week, within 10 days respectively, the remaining 10 (6.1%) gave their stool samples within two weeks.
Main point of investigation
The results of FC measurements in all three samples ranged from 3 to 2’142µg/g. Further details are shown in the scatter plot in Figure 2. The mean value of the first sample was 44.5 µg/g, the second was 60.3 µg/g, the third 41 µg/g. The mean value of the second measurements was the only one above the recommended cut-off of 50 µg/g, largely due to a single anomaly of 2142 µg/g (the other 2 values of this volunteer were normal). Excluding the anomaly led to a mean FC of 47.5 µg/g. The median value was similar in all three measurement rows with 20, 22 and 18 µg/g respectively. Further details are shown in Table 1.
114 (69.9%) of the 163 analysed individuals had three consecutive normal measurements of FC in their stool samples. Thus 49 (30.1%) of the healthy population had at least one elevated FC value. 40 (24.5%) showed both normal and elevated (>50 µg/g) values and 9 (5.5%) showed elevated values throughout. Of the 49 volunteers (30.1%) with elevated values, 25 (15.3%) had one, 15 (9.2%) two and 9 (5.5%) three elevated measurements. All volunteers with elevated values were contacted and questioned; they all felt healthy and denied taking NSAID. Those with values >50 µg/g who were agreeable received further investigation (second series of stool samples, endoscopy). This is discussed more closely below and listed in Table 2.
Analysis per sample
25 (15.3%) volunteers had an elevated value in their first stool sample, 29 (17.8 %) in the second and 28 (17.2%) had an FC value above 50 µg/g in the third stool sample. For details see the box plots in Figures 3a-c. Approximately half of those volunteers with elevated values had an elevated value in their first sample.
Cut-off
By raising the cut-off from 50 to 100 and 150 µg/g, the percentage of volunteers with three normal results went from 69.9% to 84%, and to 89.6% respectively (see Table 3). With all thresholds, approximately half of the volunteers with elevated values had the elevated value in their first sample. If the first measurement was normal, 17.4% showed elevated values in the further samples when applying a cut-off of 50 µg/g, 8.1% with 100 µg/g, and 5.2% with 150 µg/g.
Variation
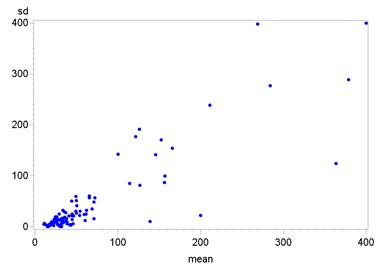
We found large variation in our samples, with a range of 0-2142 µg/g. The high value of 2142 µg/g belonged to a volunteer with two further normal values, the elevated one being the second measurement, and performed a second series with three normal values throughout. The second highest value measured in the study was 728 µg/g. The mean value (Mean) of each variable was higher than the third quartile (Q3), which means less than ¼ of the values are responsible for the large range. This also explains the at times high standard deviation (SD), whose median was only 6.93. A confounding factor for median and mean of absolute deviation (mad) of SD was that test results were often reported to be <15 or <30 µg/g, which we equated with 15 and 30 µg/g respectively. The variation is further depicted in supplementary figure 1.
The correlation according to Spearman for mean value and standard deviation is high with almost 0.9 and statistically significant with a p-value of <.0001. This is not overly surprising, since the two are still very close with only three values per person and both are highly influenced by stray values. The correlation between sd and median, the last being more resistant to strays, is 0.65, only medium strength.
Gender Bias
We did not find significant differences between men and women. In 100 women, 69 (69%) showed three results under 50 µg/g, in 63 men the number was 45 (71.43%). Changing the thresholds did not show different results. For further details, see Table 4.
Analysing the Volunteers with Elevated Calpro- tection
49 (30.1%) volunteers had at least one elevated value, 17 (10.4%) had no further investigation. Of the 17, 13 had only one elevated value, 10 of which had a value under 100 µg/g, 3 above (with values of 118, 132, 347 µg/g). The remaining 4 had two elevated values, all under 100µg/g. All had inconspicuous interviews and decided against further testing. Of the 17, 3 had gastro and colonoscopy either shortly before or after the study, and showed inconspicuous results. Of the remaining 32 volunteers with elevated values, 4 had a gastro and colonoscopy directly afterwards and 28 did a second stool series, of which 7 had endoscopy afterwards. Of the 28 volunteers who were willing to perform a second series of three stool samples, 12 had three normal values, 6 had one elevated value, 2 had two elevated values, and 7 had three elevated values in the second series. Of the last 7, 5 received endoscopy with inconspicuous results. 2 volunteers felt healthy and did not want endoscopy, 1 had two values below 100 µg/g. The other with values 201-567 µg/g initially agreed to further testing, but then cancelled due to feeling completely healthy. The volunteer was contacted again two years after the last sample and reported feeling healthy and opposed to further testing. For further details, see Table 1.
H. pylori Infection
Only volunteers who underwent endoscopy were routinely tested for H. pylori, four were positive. According to current opinion, H. pylori does not elevate FC levels [25]. One person had two elevated values in her three samples (305/94µg/g). One woman (values 140/297/699µg/g and 805/687/716µg/g) still had elevated values half a year after successful eradication (307/443/308µg/g). Another woman with elevated values (152, 245, 71µg/g) showed normal results in a second series (70/39/24 µg/g), even though H. pylori was not eradicated. One man who received a diagnosis of H. pylori infection independently from the study had three normal results (30/30/50 µg/g).
Occult Blood
139 of the 163 volunteers also had testing for occult blood with each stool sample. Two volunteers showed a positive result in one sample, in both calprotectin values were below 50 µg/g. They were referred to their general practitioner (GP) for further investigation.
Discussion
In our study with 136 intestinally healthy volunteers, 30.1% had at least one calprotectin (FC) value above 50 µg/g in three stool samples within two weeks. 24.5% had values in the normal and pathological range.
Few studies have examined FC variability in specific diseases. Lasson et al. let 18 patients with known ulcerative colitis collect two stool samples of each bowel movement for 2 days and found significant intra-individual variability with a median individual coefficient of variation of 52% (range 4-178) [18]. In a similar set up, Tibble et al. found a coefficient of variation of 54% (95%CI 21-94) [26]. Naismith et al. found an intra-class correlation of 0.84 (95%CI 0.79-0.89) in patients with Crohn’s disease [20]. However, the total agreement of all three stool samples analysed per individual was 79% at a cut-off of 50 µg/g, meaning that 21% did not have consistent values below or above. Cremer et al. looked at the FC variability in 120 patients with IBD and found high intra-individual day to day variability [27]. Husebye et al. studied 14 consecutive pts referred for colonoscopy, who did not have colonic inflammation or neoplasm, and found a coefficient of variation of 58% [28]. FC variability has thus rarely been assessed outside of IBD and, to our knowledge, never in a healthy population.
In our study with 136 volunteers, 30.1% showed day to day variation extreme enough to have at least one FC value above 50 µg/g in three stool samples within two weeks. 24.5% had values in the normal and pathological range. They thus showed a better correlation to actual disease, or lack thereof, with the consecutive measurements than just a singular one. A significant number of pathological results were in the range between 50 and 100 µg/g. The percentage of healthy volunteers with falsely pathological findings decreased to 16% by applying a cut-off of 100 µg/g. Raising the cut off to 150 µg/g led to a small further decrease. Our data thus supports the worldwide tendency to apply a cut-off of 100 µg/g for FC [2,10,17]. Our study has several limitations, largely due to its pragmatic, researcher-based design. Most importantly, we did not perform endoscopy in all participants but only in a select subpopulation with elevated FC values. This had several reasons, the comfort and safety of the participants, the influence of willingness to participate, monetary and ethical factors. Second, we did not assess for stool consistency, which should not have too much variation or influence in our presumed healthy population. Third, we did not assess time between bowel movements, although a longer in-between time might lead to higher FC levels [18]. To minimize this risk, we advised our participants to take their samples from the first bowel movement of the day. Additionally, it can be argued that a healthy individual should not have elevated FC values even after a longer stool lying time, as long as it is in the range considered healthy. Those with obstipation (>5days between bowel movements) were excluded from the study. Fourth, the time between collection of stool sample and analysis can influence results. According to current data, FC-values stay stable for several days and show a decrease after approximately seven days [18]. The laboratory used did FC testing Monday through Friday. To circumvent this issue, we advised our participants to collect stool samples in the range of Monday to Thursday. Fifth, we did not take blood samples, so we do not know if the participants had elevated inflammation markers in their blood.
In summary, our data showed a high variability in healthy individuals, with ¼ having normal as well as pathological values in three consecutive stool samples. This leads us to the suggestion that more than one stool sample could be performed to reach clinical decisions in patients with gastrointestinal symptoms. To definitely determine a recommendation, studies are needed in that population, ideally with endoscopy control.
Funding
This work was supported by MCL Medizinische Laboratorien Niederwangen, Switzerland. They covered the costs of the laboratory analyses. No additional funding was received.
Acknowledgment
Retired Professor of Statistics of the University of Berne, Jürg Hüsler, performed a large part of the statistical analysis and contributed several figures.
Statement of Interest
The authors have no personal interests to declare.
Financial support: Laboratory testing was financed by MCL Laboratorien Niederwangen, Switzerland. No other financial support was received. Potential competing interests: All authors have no conflict of interest to declare.
Ethics: The study was approved by the Swiss Ethics committee of Berne, Switzerland (KEK-number 334/15) on June 1st, 2016.
- Aadland E, Fagerhol MK (2002) Faecal calprotectin: a marker of inflammation throughout the intestinal tract. Eur J Gastroenterol Hepatol 14: 823-5.
- Pavlidis P, Chedgy FJ, Tibble JA (2013) Diagnostic accuracy and clinical application of faecal calprotectin in adult patients presenting with gastrointestinal symptoms in primary care. Scand J Gastroenterol 48: 1048-54.
- Sood R, Gracie DJ, Law GR, Ford AC (2015) Systematic review with meta-analysis: the accuracy of diagnosing irritable bowel syndrome with symptoms, biomarkers and/or psychological markers. Aliment Pharmacol Ther 42: 491-503.
- Burri E, Beglinger C (2012) Faecal calprotectin -- a useful tool in the management of inflammatory bowel disease. Swiss Med Wkly 142: w13557.
- Kalantari H, Taheri A, Yaran M (2015) Fecal calprotectin is a useful marker to diagnose ulcerative colitis from irritable bowel syndrome. Adv Biomed Res 4: 85.
- Schoepfer AM, Beglinger C, Straumann A et al. (2010) Fecal calprotectin correlates more closely with the Simple Endoscopic Score for Crohn's disease (SES-CD) than CRP, blood leukocytes, and the CDAI. Am J Gastroenterol 105: 162-9.
- Lehmann FS, Burri E, Beglinger C (2015) The role and utility of faecal markers in inflammatory bowel disease. Therap Adv Gastroenterol 8: 23-36.
- Saadoun MM, Nosair NAE, Abdel-Azeez HA, Sharaf SM, Ahmed MH (2021) Serum Visfatin as a Diagnostic Marker of Active Inflammatory Bowel Disease. J Gastrointestin Liver Dis 30: 339-45.
- Tibble JA, Sigthorsson G, Bridger S, Fagerhol MK, Bjarnason I (2000) Surrogate markers of intestinal inflammation are predictive of relapse in patients with inflammatory bowel disease. Gastroenterology 19: 15-22.
- Tham YS, Yung DE, Fay S et al. (2018) Fecal calprotectin for detection of postoperative endoscopic recurrence in Crohn's disease: systematic review and meta-analysis. Therap Adv Gastroenterol 11: 1756284818785571.
- Brookes MJ, Whitehead S, Gaya DR, Hawthorne AB (2018) Practical guidance on the use of faecal calprotectin. Frontline Gastroenterol 9: 87-91.
- Turvill J, O'Connell S, Brooks A et al. (2016) Evaluation of a faecal calprotectin care pathway for use in primary care. Prim Health Care Res Dev 17: 428-36.
- Freeman K, Taylor-Phillips S, Willis BH, Ryan R, Clarke A (2021) Test accuracy of faecal calprotectin for inflammatory bowel disease in UK primary care: a retrospective cohort study of the IMRD-UK data. BMJ Open 11: e044177.
- NICE NifHaCE (2015) Guidelines for the use of faecal calprotectin testing in primary care.
- Burri E BC (2016) Diagnostischer Nutzen von Calprotectin im klinischen Alltag. Swiss Medical Forum 16: 68-73.
- van Rheenen PF, Van de Vijver E, Fidler V (2010) Faecal calprotectin for screening of patients with suspected inflammatory bowel disease: diagnostic meta-analysis. BMJ 341: c3369.
- Boschetti G, Laidet M, Moussata D et al. (2015) Levels of Fecal Calprotectin Are Associated With the Severity of Postoperative Endoscopic Recurrence in Asymptomatic Patients With Crohn's Disease. Am J Gastroenterol 110: 865-72.
- Lasson A, Stotzer PO, Ohman L, Isaksson S, Sapnara M et al. (2015) The intra-individual variability of faecal calprotectin: a prospective study in patients with active ulcerative colitis. J Crohns Colitis 9: 26-32.
- Moum B, Jahnsen J, Bernklev T (2010) Fecal calprotectin variability in Crohn's disease. Inflamm Bowel Dis 16: 1091-2.
- Naismith GD, Smith LA, Barry SJ et al. (2013) A prospective single-centre evaluation of the intra-individual variability of faecal calprotectin in quiescent Crohn's disease. Aliment Pharmacol Ther 37: 613-21.
- Bühlmann fCal ELISA 2015.
- Juricic G, Brencic T, Tesija-Kuna A, Njegovan M, Honovic L (2019) Faecal calprotectin determination: impact of preanalytical sample treatment and stool consistency on within- and between-method variability. Biochem Med (Zagreb) 29: 010707.
- Godbole G, Megraud F, Bessede E (2020) Review: Diagnosis of Helicobacter pylori infection. Helicobacter 25: e12735.
- Lee MW, Pourmorady JS, Laine L (2020) Use of Fecal Occult Blood Testing as a Diagnostic Tool for Clinical Indications: A Systematic Review and Meta-Analysis. Official journal of the American College of Gastroenterology | ACG 115: 662-70.
- Lahat A, Kopylov U, Neuman S et al. (2017) Helicobacter pylori prevalence and clinical significance in patients with quiescent Crohn's disease. BMC Gastroenterol 17: 27.
- Tibble J, Teahon K, Thjodleifsson B et al. (2000) A simple method for assessing intestinal inflammation in Crohn's disease. Gut 47: 506-13.
- Cremer A, Ku J, Amininejad L et al. (2019) Variability of Faecal Calprotectin in Inflammatory Bowel Disease Patients: An Observational Case-control Study. J Crohns Colitis 13: 1372-9.
- Husebye E, Ton H, Johne B (2001) Biological variability of fecal calprotectin in patients referred for colonoscopy without colonic inflammation or neoplasm. Am J Gastroenterol 96: 2683-7.
FIGURE 1
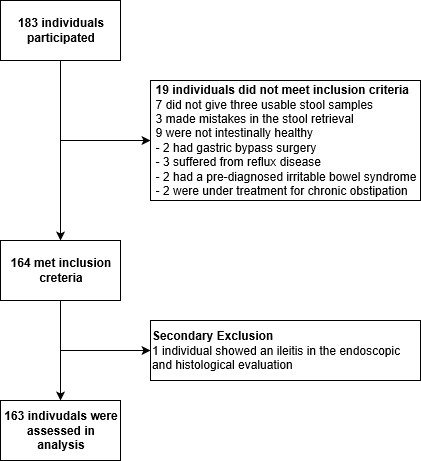
Figure 1: Flow chart
FIGURE 2
Abbreviations: Cal: faecal calprotectin (FC) in μg/g; cal1-3: results of the first through third FC measurement. Rep: red represents the second,
blue the third measurement.
How to read the table: the x-axis shows the first calprotectin measurement (Cal1), red on the y-axis shows the second measurement (cal2),
blue on the y-axis the third (cal3). 6 values (from 6 different volunteers) > 400 μg/g were not documented for better visibility: 587 and 489 in
the first measurement, 2142 and 728 in the second, and 699 and 485 in the third measurement.
Figure 2: Faecal Calprotectin measurements per volunteer
FIGURE 3

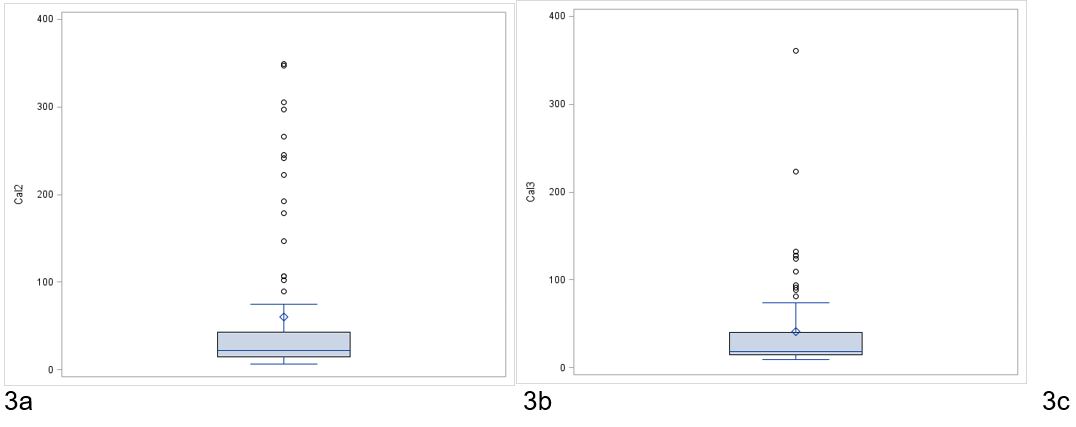
Feacal calprotectin in μg/g. The box plots show median and interquartile range, mean (small square) and standard deviation, as well as
outliers. 6 values (from 6 volunteers) > 400 μg/g were not documented for better visibility: 587 and 489 μg/g in the first measurement, 2142
and 728 μg/g in the second, and 699 and 485 μg/g in the third measurement.
Figure 3: Boxplots of the first (a), second (b) and third (c) calprotectin measurement
FIGURE 4
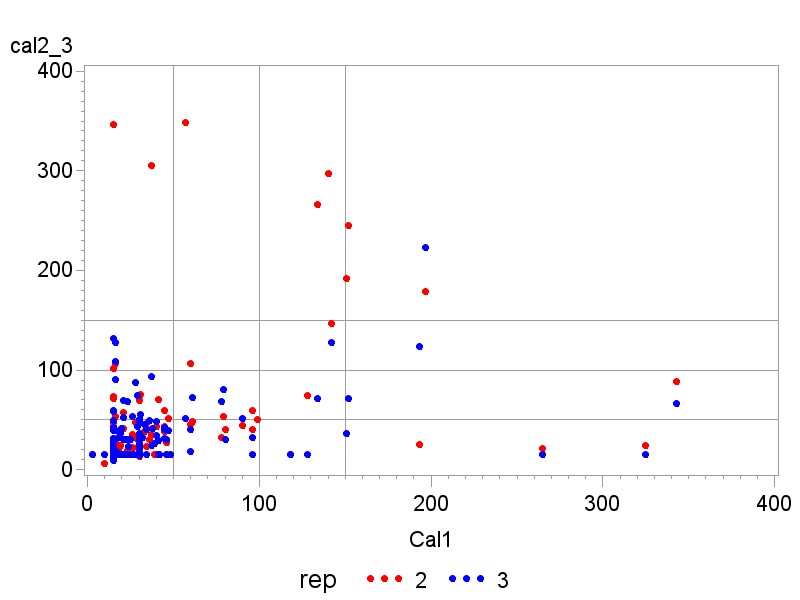
Figure of calprotectin values (μg/g) of 163 volunteers; sd: standard deviation
Supplementary Figure 1: Range comparison
Tables at a glance
Figures at a glance