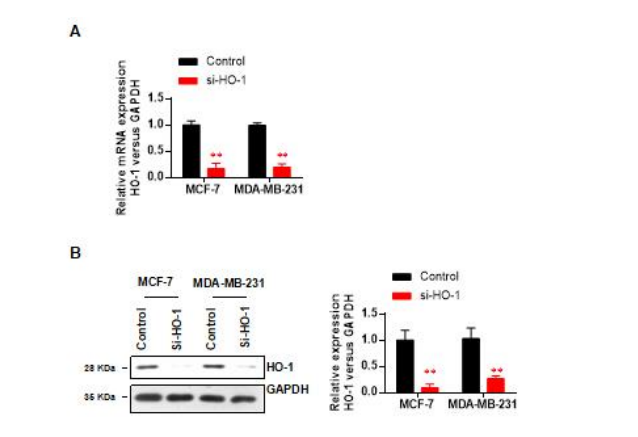
Figure 1: Knockdown efficiency validation of HO-1. (A) HO-1 mRNA levels of two cell lines; (B) the HO-1 protein levels of two cell lines
Data represent mean ± SD; n = 3 in each group. ** p < 0.01 (si-HO-1 vs control)
Figure 1: Knockdown efficiency validation of HO-1. (A) HO-1 mRNA levels of two cell lines; (B) the HO-1 protein levels of two cell lines
Data represent mean ± SD; n = 3 in each group. ** p < 0.01 (si-HO-1 vs control)
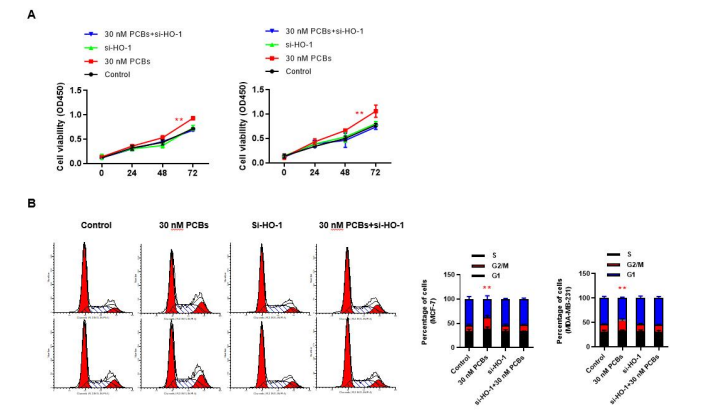
Figure 2: HO-1 silence blocked the proliferation promoting effect of PCB expose. (A) The cell viability of 72-h culture was determined by the CCK-8 method. For both BC cell lines (Left: MCF-7; Right: MDA-MB-231). (B) The cell cycle distribution of different groups in MCF-7 and MDA-MB-231 cells (Left: MCF-7; Right: MDA-MB-231)
Data represent mean ± SD; n = 3 in each group. ** p < 0.01 (PCB+si-HO-1 vs PCB)
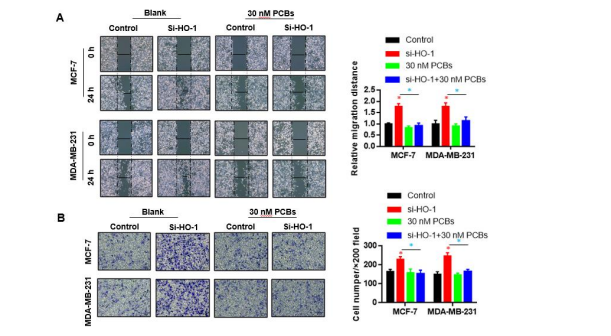
Figure 3: HO-1 silence blocked the migration/invasion promoting effect of PCB expose. (A) PCB exposure enhanced the migration distance in 24 h compared with control, and this effect was abolished by the HO-1 siRNA treatment. (B) The invasion abilities of both BC cells were boosted by PCB, which were blocked by HO-1 siRNA administration
Data represent mean ± SD; n = 3 in each group. * p < 0.05 (Red: Control vs PCB; Blue: PCB+si-HO-1 vs PCB).
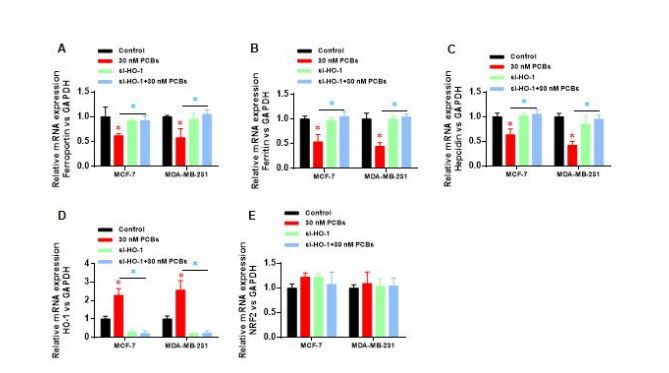
Figure 4: HO-1 silence recovered the damage of PCB exposure on iron metabolism related genes. Real-time PCR was used to evaluate the mRNA expression of iron metabolism associated genes: (A) ferrportin, (B) ferritin, (C) hepcidin. (D) HO-1 mRNA expression. (E) Nrf2 mRNA expression
Data represent mean ± SD; n = 3 in each group. * p < 0.05 (Red: Control vs PCB; Blue: PCB+si-HO-1 vs PCB).
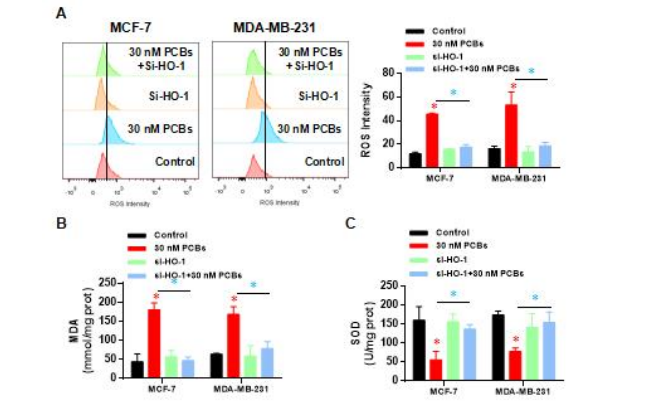
Figure 5: HO-1 silence attenuated the oxidative damage from PCB exposure. (A) The intracellular ROS intensity. (B) Malondialdehyde (MDA) levels. (C) Superoxide dismutase (SOD) levels
Data represent mean ± SD; n = 3 in each group. * p < 0.05 (Red: Control vs PCB; Blue: PCB+si-HO-1 vs PCB).
Figures at a glance