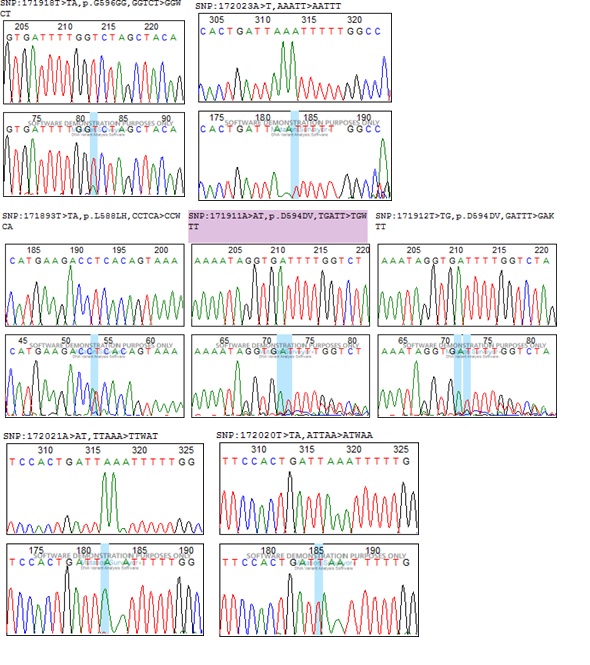
Figure 1
BRAF gene mutations
Figure 1
BRAF gene mutations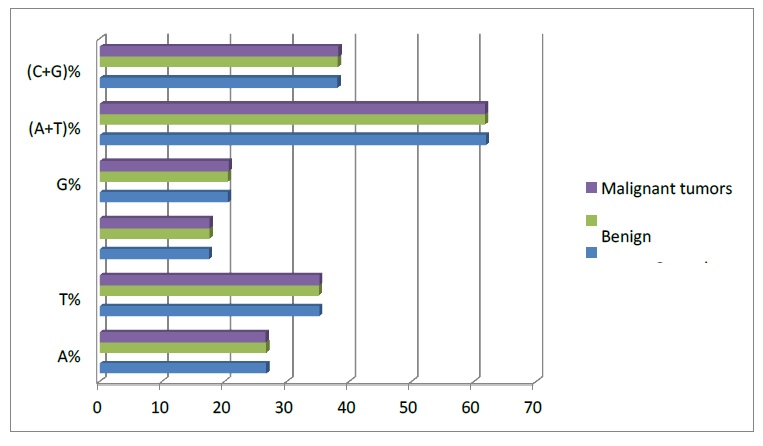
Figure 2
Nucleotide frequencies of the sequences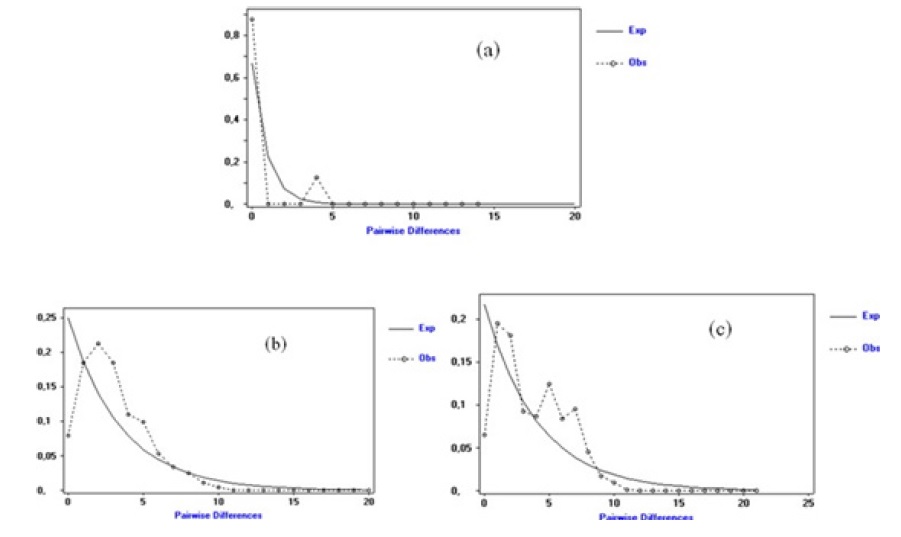
Figure 3 Mismatch curves distribution of controls (a), benign tumors (b) and malignant tumors (c) The SSD, control (0.01093; p=0.55000), TB (0.00346; p=0.59000) and TM (0.00988; p=0.48000) values are positive and not significant for the three groups (Table 6). The values of Rag, controls (0.05005; p = 0.78000), TB (0.02122; p = 0.83000) and TM (0.03150; p=0.36000) are positive and not significant (Table VII).
NUCLEOTIDE POSITION |
AMINO ACIDS |
NUMBER |
CONTROLS |
||
172023A>AT |
|
2 |
BENIGN TUMORS |
||
171893T>TA ; mut het T1763A |
L588H |
1 |
171918T> TA ; mut het T1788A |
G596G |
1 |
171911A>AT ; mut het A1781T |
D594V dbSNP 121913338 |
1 |
171912T>TC ; mut het T1782C |
D594V |
1 |
172023A>AT |
|
3 |
172032C>CA |
|
1 |
MALIGNANT TUMORS |
||
171924T>TA ; mut het T1794A |
A598AA |
1 |
172021A>AT |
|
4 |
172020T>TA |
|
1 |
172023A>AT |
|
1 |
172032C>CA |
|
1 |
172032C>CT |
|
1 |
Table 1:Nature and frequency of mutations
Diversity indices |
Controls |
Benign tumors |
Malignant tumors |
Number of sequences, n |
12 |
31 |
35 |
Number of sites, N |
181 |
181 |
181 |
Monomorphic sites |
173 |
164 |
161 |
Polymorphic sites |
8 |
17 |
20 |
Singleton variable sites |
6 |
10 |
9 |
Parsimony informative sites |
2 |
7 |
11 |
Total number of mutations,Eta |
10 |
22 |
26 |
Total number of singleton mutations Eta (s) |
8 |
17 |
20 |
Number of haplotypes, h |
6 |
18 |
23 |
Average number of nucleotide differences (k) |
2.045 |
3.009 |
3.615 |
Transitions (%) |
26.51 |
21.18 |
46.82 |
Transversions (%) |
73.42 |
78.82 |
53.16 |
R (transition rates/ transversal rates) |
0.318 |
0.238 |
0.807 |
Haplotypical diversity (hd) |
0.818 |
0.920 |
0.934 |
Nucleotide diversity (π) |
0.01130 |
0.01662 |
0.01997 |
Table 2:Values of genetic diversity indices for each population
Amino acids |
Controls |
Benign tumours |
Malignant tumours |
P-value T vsTB |
P-value T vs TM |
P-value TB vs TM |
Ala |
5.15 |
5.07 |
5.15 |
0.9795 |
1 |
0.9795 |
Cys |
0.14 |
0.05 |
0.05 |
0.8363 |
0.8363 |
1 |
Asp |
5.01 |
5.02 |
5.00 |
0.9974 |
0.9974 |
0.9948 |
Glu |
5.01 |
5.02 |
5.00 |
0.9974 |
0.9974 |
0.9948 |
Phe |
9.74 |
9.49 |
9.68 |
0.9522 |
0.9886 |
0.9636 |
Gly |
6.68 |
6.69 |
6.67 |
0.9977 |
0.9977 |
0.9955 |
His |
3.34 |
3.34 |
3.34 |
1 |
1 |
1 |
Ile |
10.15 |
10.30 |
10.15 |
0.9721 |
1 |
0.9721 |
Lys |
5.01 |
4.96 |
4.81 |
0.987 |
0.9478 |
0.9608 |
Leu |
11.82 |
12.03 |
11.96 |
0.9635 |
0.9756 |
0.9878 |
Met |
1.67 |
1.73 |
1.76 |
0.9738 |
0.9609 |
0.9871 |
Asn |
0.00 |
0.05 |
0.10 |
0.823 |
0.7518 |
0.8972 |
Pro |
1.67 |
1.94 |
2.05 |
0.886 |
0.8424 |
0.9556 |
Gln |
3.34 |
3.34 |
3.34 |
1 |
1 |
1 |
Arg |
3.34 |
3.40 |
3.34 |
0.9812 |
1 |
0.9812 |
Ser |
10.15 |
10.30 |
10.30 |
0.9721 |
0.9721 |
1 |
Thr |
6.68 |
6.47 |
6.34 |
0.9522 |
0.9224 |
0.9701 |
Val |
5.01 |
5.02 |
5.00 |
0.9974 |
0.9974 |
0.9948 |
Trp |
3.34 |
3.34 |
3.34 |
1 |
1 |
1 |
Tyr |
2.78 |
2.43 |
3.34 |
0.8765 |
0.8182 |
0.7007 |
Table 3:Frequencies of BRAF amino acids
Groupes |
Intra group genetic distances |
Inter group genetic distances |
Fst |
Controls |
0.01 |
0.0139 |
0 P-value=0.86486 |
Benign tumors |
0.02 |
||
Controls |
|
0.0159 |
0 P-value=0.76577 |
Malignant tumors |
0.02 |
||
Benign tumors |
|
0.0186 |
0 P-value=0.48649 |
Malignant tumors |
|
Table 4:Intra- and inter-group genetic distances and differentiation index (Fst)
Parameters |
Controls |
Benign tumors |
Malignant tumors |
P-value Controls |
P-value TB |
P-value TM |
dN/dS |
0.01 |
0.037 |
0.064 |
1.023 |
1.802 |
1.529 |
D de Tajima |
-0.90996 |
-0.99594 |
-0.86541 |
0.2 |
0.154 |
0.211 |
D* de Fu et Li |
-0.06286 |
-0.07713 |
-0.11543 |
0.46000 |
1.13637 |
0.48800 |
F* de Fu et Li |
-0.07359 |
-0.05006 |
-0.06326 |
0.47100 |
0.45200 |
0.45500 |
H de Fay et Wu |
-0.14000 |
-0.06436 |
-0.22133 |
0.35400 |
0.33500 |
0.33300 |
R2 |
0.16074 |
0.16370 |
0.16088 |
0.000 |
0.000 |
0.000 |
Table 5:Values of the Selection Signature Tests
Parameters |
Controls |
Benign tumors |
Malignant tumors |
SSD |
0.01093 P-value= 0.55000 |
0.00346 P-value= 0.59000 |
0.00988 P-value= 0.48000 |
Rag |
0.05005 P-value= 0.78000 |
0.02122 P-value= 0.83000 |
0.03150 P-value=0.36000 |
Table 6:Values of SSDs, Rags, and their P-values