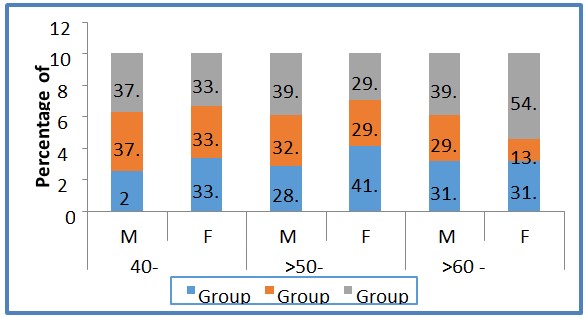
Mostly patients were in the age group of 60-70 years (n=108), group A had 54, 49 were in group B and 69 in group C.
Figure 1: Pictorial representation showing significance of differences in participant population anthropometric strata
Mostly patients were in the age group of 60-70 years (n=108), group A had 54, 49 were in group B and 69 in group C.
Figure 1: Pictorial representation showing significance of differences in participant population anthropometric strata
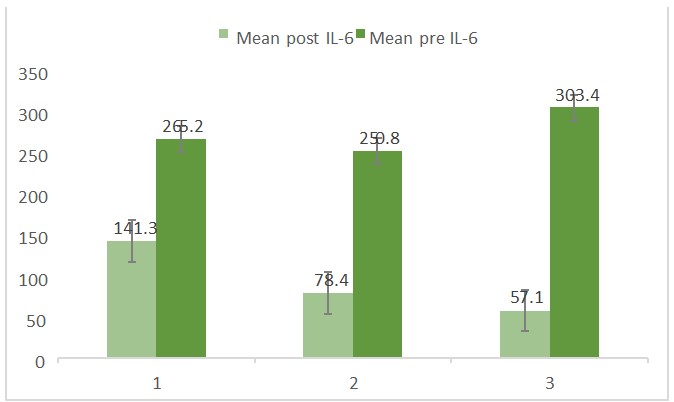
Levels of IL-6 recorded pre and post intervention for the three treatment groups A, B and C showed a significant statistical difference (p<0.05) (Figure 2).
Figure 2: Illustrates the comparison of pre and post intervention IL6 levels in study groups
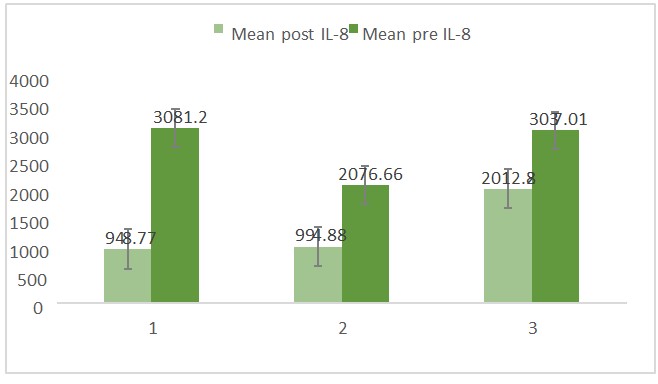
Statistically significant difference were observed in the post intervention mean concentration IL-8 levels between two treatment groups, A and C (p < 0.05) B and C (p< 0.05) (Figure 3).
Figure 3: Illustrates the comparison of pre and post intervention of IL-8 levels in the study group
Tables at a glance
Figures at a glance