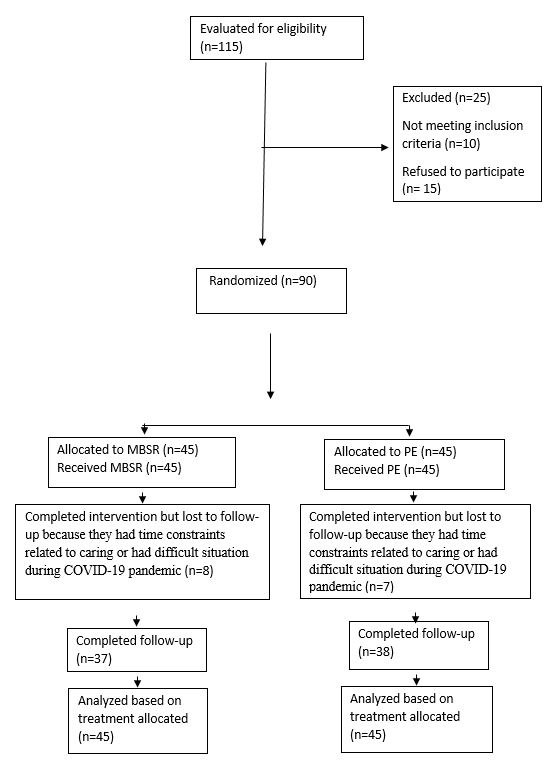
Figure 1: The process of selecting study participants
Variable |
Normal-BMD (n=100)n (%) |
Osteoporosis(n=101)n (%) |
P |
Age Mean (SD) |
55.3 (3.6) |
58.3 (3.7) |
<0.001* |
Menopausal age (year) Mean (SD) |
49.3 (3.5) |
48.2 (3.9) |
0.034* |
Job |
|
|
0.140 ± |
Housewife |
84 (84.0%) |
92 (91.1%) |
|
Employed |
16 (16.0%) |
9 (8.9%) |
|
Adequacy of family income |
|
|
0.394ǂ |
Adequate |
24 (24.0%) |
18 (17.8%) |
|
Somewhat adequate |
66 (66.0 %) |
68 (67.3%) |
|
Insufficient |
101 (10.0%) |
15 (14.9%) |
|
Marital status |
|
|
0.079± |
Single, divorced, widow |
15 (15.0%) |
26 (25.7%) |
|
Married |
85 (85.0%) |
75 (74.3%) |
|
Education |
|
|
0.002ǂ |
Illiterate |
15 (15.0%) |
33 (32.7%) |
|
Primary school |
31 (31.0%) |
40 (39.6%) |
|
Secondary school |
15 (15.0%) |
11 (10.9%) |
|
High school/Diploma |
27 (27.0%) |
12 (11.9%) |
|
Academic |
12 (12.0%) |
5 (5.0%) |
|
Smoking status |
|
|
0.683± |
No smoking or history of use |
98 (98.0%) |
97 (96.0%) |
|
Current use or previous use |
2 (2.0%) |
4 (4.0%) |
|
Exposure to direct sunlight(Yes) |
42 (42.0%) |
45 (44.6%) |
0.776± |
Number of exposed days/week Mean (SD) |
4.4 (2.3) |
4.2 (2.3) |
0.687* |
Number of exposed minutes/day Mean (SD) |
33.2 (21.8) |
33.0 (23.5) |
0.957* |
Supplement use: Ca, Vit D (Yes) |
50 (50.0%) |
59 (58.4%) |
0.259± |
Mild physical activity (Yes) |
100 (100.0%) |
100 (99.0%) |
1.0± |
Moderate physical activity (Yes) |
23 (23.0%) |
29 (28.7%) |
0.421± |
Vigorous physical activity (Yes) |
14 (14.0%) |
15 (14.9%) |
1.0± |
Fracture history in close relatives(Yes) |
8 (8.0%) |
17 (16.8%) |
0.086± |
Body Mass Index (kg/m2) Mean (SD) |
31.3 (5.0) |
28.4 (3.7) |
<0.001* |
Hypertension |
39 (39.0%) |
39 (38.6%) |
1.0± |
Dyslipidemia |
8 (8.0%) |
10 (9.9%) |
0.806± |
BMD/ L.S (g/cm2) Mean (SD) |
1.0 (0.2) |
0.71 (0.07) |
<0.001* |
T-score/ L.S Mean (SD) |
-0.11 (0.9) |
-3.09 (0.6) |
<0.001* |
Z-score/ L.S Mean (SD) |
0.97 (0.9) |
-1.7 (0.7) |
<0.001* |
BMD/ F.N (g/cm2) Mean (SD) |
0.97 (0.1) |
0.75 (0.1) |
<0.001* |
T-score/ F.N Mean (SD) |
0.18 (0.8) |
-1.6 (0.7) |
<0.001* |
Z-score/ F.N Mean (SD) |
0.92 (0.8) |
-0.69 (0.8) |
<0.001* |
Fat(g/d) |
68.61(19.1) |
71.62(26.43) |
0.478* |
Energy(Kcal/d) |
1905.3(419.4) |
1818.2(658.4) |
0.392* |
carbohydrate(g/d) |
272.7(70.7) |
255.5(108.1) |
0.312* |
protein(g/d) |
58.8(17.2) |
51.6(18.0) |
0.029* |
Vitamin D(µg/d) |
1.8 (1.2) |
1.6(1.3) |
0.363* |
Vitamin C(mg/d) |
226.2(119.7) |
203.6(126.8) |
0.222* |
Zinc(mg/d) |
8.5(2.4) |
8.3(3.0) |
0.220* |
Selenium(µg/d) |
87.0(33.8) |
84.0(32.1) |
0.350* |
Table 1: Socio-demographic characteristics of postmenopausal women by bone density
BMD: Bone mineral density; L.S: Lumbar spine; F.N: Femoral neck *Independent t test ǂ Linear by linear chi-square ±Fisher’s exact test
Inflammatory biomarkers |
Normal-BMD (n=100) |
Osteoporosis (n=101) |
p* |
||
Mean (SD) |
Median (IQR) |
Mean (SD) |
Median (IQR) |
||
Interleukin-6 (pg/ml) |
22.14 (17.03) |
19.26 (6.26) |
26.41 (26.76) |
19.42 (7.75) |
0.289 |
Tumor necrosis factors (pg/ml) |
33.76 (27.29) |
25.45 (13.03) |
33.60 (31.39) |
20.76 (16.84) |
0.026 |
hs-CRP (mg/L) |
0.28 (0.33) |
0.25 (0.31) |
0.96 (0.58) |
0.95 (0.67) |
<0.001 |
BMD: bone mineral density
p* Mann-Whitney U
Table 2: Serum inflammatory biomarkers among postmenopausal women with normal bone density and osteoporosis
Inflammatory biomarkers |
Normal-BMD (n=100) |
Osteoporosis (n=101) |
p* |
||
Mean (SD) |
Median (IQR) |
Mean (SD) |
Median (IQR) |
||
Interleukin-6 (pg/ml) |
22.14 (17.03) |
19.26 (6.26) |
26.41 (26.76) |
19.42 (7.75) |
0.289 |
Tumor necrosis factors (pg/ml) |
33.76 (27.29) |
25.45 (13.03) |
33.60 (31.39) |
20.76 (16.84) |
0.026 |
hs-CRP (mg/L) |
0.28 (0.33) |
0.25 (0.31) |
0.96 (0.58) |
0.95 (0.67) |
<0.001 |
* Adjusted for age, menopause age, BMI, and education. Reference group: Normal-BMD Interleukin-6: Hosmer and Lemeshow p=0.182, Chi-square=11.36 df=8
Tumor necrosis factors: Hosmer and Lemeshow p=0.391 Chi-square=8.45 df=8
hs-CRP: Hosmer and Lemeshow p=0.551, Chi-square=6.86, df=8
Table 3: Binary logistic regression model for estimating the odds of primary osteoporosis based on serum inflammatory biomarkers in post- menopausal women
Figure 1: The process of selecting study participants
Tables at a glance
Figures at a glance