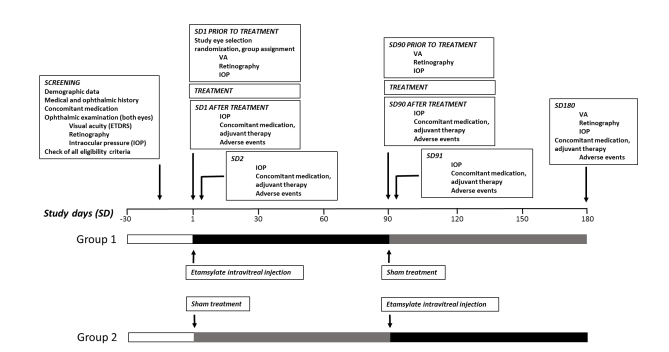
Figure 1: Schematic representation of Jericho-D study design
Figure 1: Schematic representation of Jericho-D study design
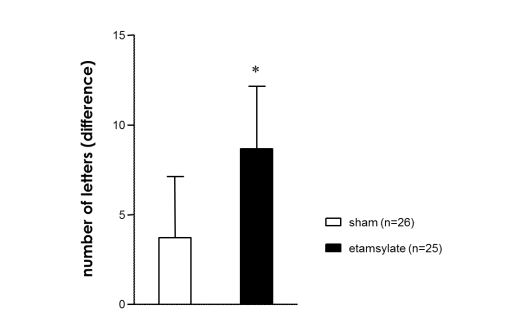
Figure 2: Intravitreal injection of etamsylate improves visual acuity in patients with dry age-related macular degeneration at 90 days follow-up
Tables at a glance
Figures at a glance