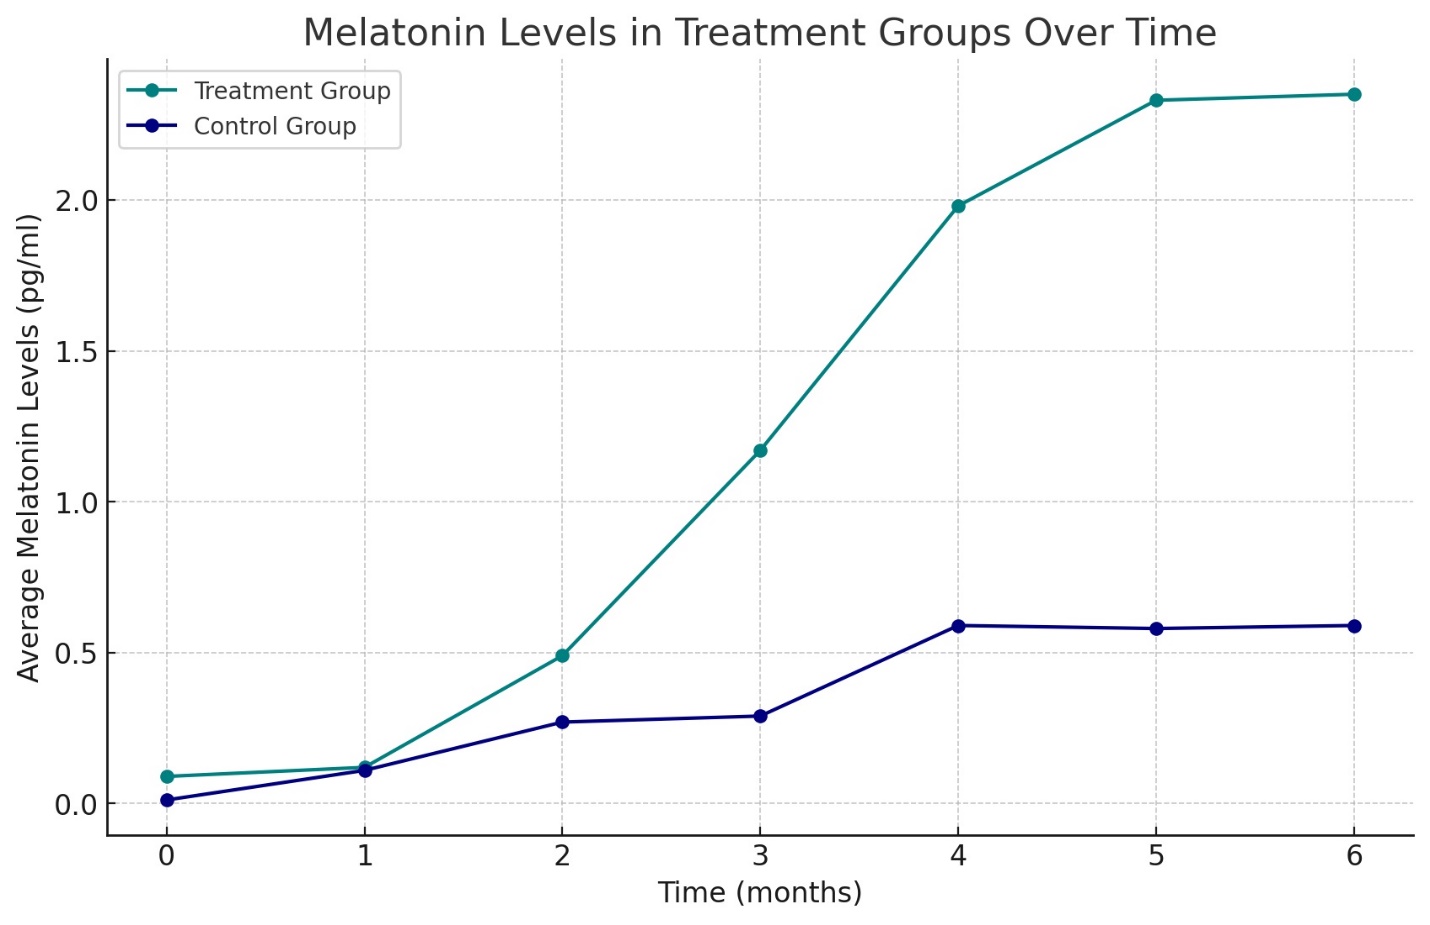
Graph N1: Shows the monthly melatonin levels for both groups
Regions |
||||||
Patient 24-57 |
Age |
Weight (kg) |
Height (cm) |
|||
N1 |
24 |
80 |
187 |
|||
N2 |
25 |
78 |
162 |
|||
N3 |
25 |
87 |
155 |
|||
N4 |
26 |
89 |
185 |
|||
N5 |
27 |
99 |
178 |
|||
N6 |
27 |
76 |
169 |
|||
N7 |
27 |
70 |
195 |
|||
N8 |
27 |
69 |
187 |
|||
N9 |
28 |
85 |
184 |
|||
N10 |
29 |
87 |
179 |
|||
N11 |
29 |
93 |
170 |
|||
N12 |
30 |
99 |
187 |
|||
N13 |
31 |
77 |
190 |
|||
N14 |
32 |
79 |
159 |
|||
N15 |
32 |
103 |
192 |
|||
N16 |
33 |
99 |
182 |
|||
N17 |
34 |
107 |
171 |
|||
N18 |
34 |
112 |
175 |
|||
N19 |
35 |
69 |
164 |
|||
N20 |
36 |
75 |
167 |
|||
N21 |
37 |
89 |
177 |
|||
N22 |
44 |
95 |
185 |
|||
N23 |
47 |
110 |
179 |
|||
N24 |
50 |
109 |
199 |
|||
N25 |
50 |
87 |
189 |
|||
N26 |
55 |
91 |
181 |
|||
N27 |
57 |
97 |
177 |
|||
N28 |
57 |
103 |
187 |
|||
Table N1: Patientʹs vital statistics
A total 28 person |
CD4+ monthly levels in the treatment group (High dose Lycopene, High dose Piceatannol and Ademethionine) |
CD4+ in monthly levels in the Control group with only Ademethionine |
Before treatment |
Average CD4+ cells levels 32% 109/L |
Average CD4+ cells levels 35% 109/L |
End of the 1 month |
Average CD4+ cells levels 39% 109/L |
Average CD4+ cells levels 37% 109/L |
End of the second month |
Average CD4+ cells levels 42% 109/L |
Average CD4+ cells levels 39% 109/L |
End of the 3 month |
Average CD4+ cells levels 49% 109/L |
Average CD4+ cells levels 43% 109/L |
End of the 4 month |
Average CD4+ cells levels 52% 109/L |
Average CD4+ cells levels 42% 109/L |
End of the 5 month |
Average CD4+ cells levels 52% 109/L |
Average CD4+ cells levels 41% 109/L |
End of the 6 month |
Average CD4+ cells levels 53% 109/L |
Average CD4+ cells levels 43% 109/L |
Table N2: CD4+ cells monthly levels in the treatment group (High dose Lycopene, High dose Piceatannol and Ademethionine) and in the in the Control group with only Ademethionine
Regions |
||||||
A total 28 person |
INF-alpha and gamma-INF monthly levels in the treatment group (High dose Lycopene, High dose Piceatannol and Ademethionine) |
INF-alpha and gamma-INF monthly levels in the Control group with only Ademethionine |
||||
Before treatment |
Average INF-alpha level 22.3 pg/ml (normal range 24-87 pg/ml) Average gamma-INF level 3.7 pg/ml (normal range <5 pg/ml)
|
Average INF-alpha level 27.1 pg/ml (normal range 24-87 pg/ml) Average gamma-INF level 2.3 pg/ml (normal range <5 pg/ml) |
||||
End of the 1 month |
Average INF-alpha level 33.5 pg/ml (normal range 24-87 pg/ml) Average gamma-INF level 3.9 pg/ml (normal range <5 pg/ml) |
Average INF-alpha level 27.9 pg/ml (normal range 24-87 pg/ml) Average gamma-INF level 3.7 pg/ml (normal range <5 pg/ml) |
||||
End of the second month |
Average INF-alpha level 37.1 pg/ml (normal range 24-87 pg/ml) Average gamma-INF level 3.7 pg/ml (normal range <5 pg/ml) |
Average INF-alpha level 33.7 pg/ml (normal range 24-87 pg/ml) Average gamma-INF level 3.5 pg/ml (normal range <5 pg/ml) |
||||
End of the 3 month |
Average INF-alpha level 41.0 pg/ml (normal range 24-87 pg/ml) Average gamma-INF level 3.9 pg/ml (normal range <5 pg/ml) |
Average INF-alpha level 35.3 pg/ml (normal range 24-87 pg/ml) Average gamma-INF level 2.9 pg/ml (normal range <5 pg/ml) |
||||
End of the 4 month |
Average INF-alpha level 47.9 pg/ml (normal range 24-87 pg/ml) Average gamma-INF level 4.3 pg/ml (normal range <5 pg/ml) |
Average INF-alpha level 37.2 pg/ml (normal range 24-87 pg/ml) Average gamma-INF level 3.1 pg/ml (normal range <5 pg/ml) |
||||
End of the 5 month |
Average INF-alpha level 53.9 pg/ml (normal range 24-87 pg/ml) Average gamma-INF level 4.1 pg/ml (normal range <5 pg/ml) |
Average INF-alpha level 35.2 pg/ml (normal range 24-87 pg/ml) Average gamma-INF level 3.5 pg/ml (normal range <5 pg/ml) |
||||
End of the 6 month |
Average INF-alpha level 53.3 pg/ml (normal range 24-87 pg/ml) Average gamma-INF level 4.0 pg/ml (normal range <5 pg/ml) |
Average INF-alpha level 35.9 pg/ml (normal range 24-87 pg/ml) Average gamma-INF level 3.4 pg/ml (normal range <5 pg/ml) |
||||
Table N3: INF-alpha and gamma-INF monthly levels in the treatment group (High dose Lycopene, High dose Piceatannol and Ademethionine) and in the Control group with only Ademethionine
A total 28 person |
CRP normal serum/plasma range < 5 mg/L monthly levels in the treatment group (High dose Lycopene, High dose Piceatannol and Ademethionine) |
CRP normal serum/plasma range < 5 mg/L monthly levels in the Control group with only Ademethionine |
Before treatment |
Average CRP level 18.2 pg/ml |
Average CRP level 19.5 pg/ml |
End of the 1 month |
Average CRP level 15.1 pg/ml |
Average CRP level 17.2 pg/ml |
End of the second month |
Average CRP level 9.5 pg/ml
|
Average CRP level 17.5 pg/ml |
End of the 3 month |
Average CRP level 5.3 pg/ml |
Average CRP level 15.5 pg/ml |
End of the 4 month |
Average CRP level 4.5 pg/ml |
Average CRP level 16.7 pg/ml |
End of the 5 month |
Average CRP level 4.3 pg/ml |
Average CRP level 15.9 pg/ml |
End of the 6 month |
Average CRP level 4.3 pg/ml |
Average CRP level 16.2 pg/ml |
Table N4: CRP, SSA, IL-6, TNF-alpha - monthly levels in the treatment (with High dose Lycopene, High dose Piceatannol and Ademethionine) and in the control group
Graph N1: Shows the monthly melatonin levels for both groups
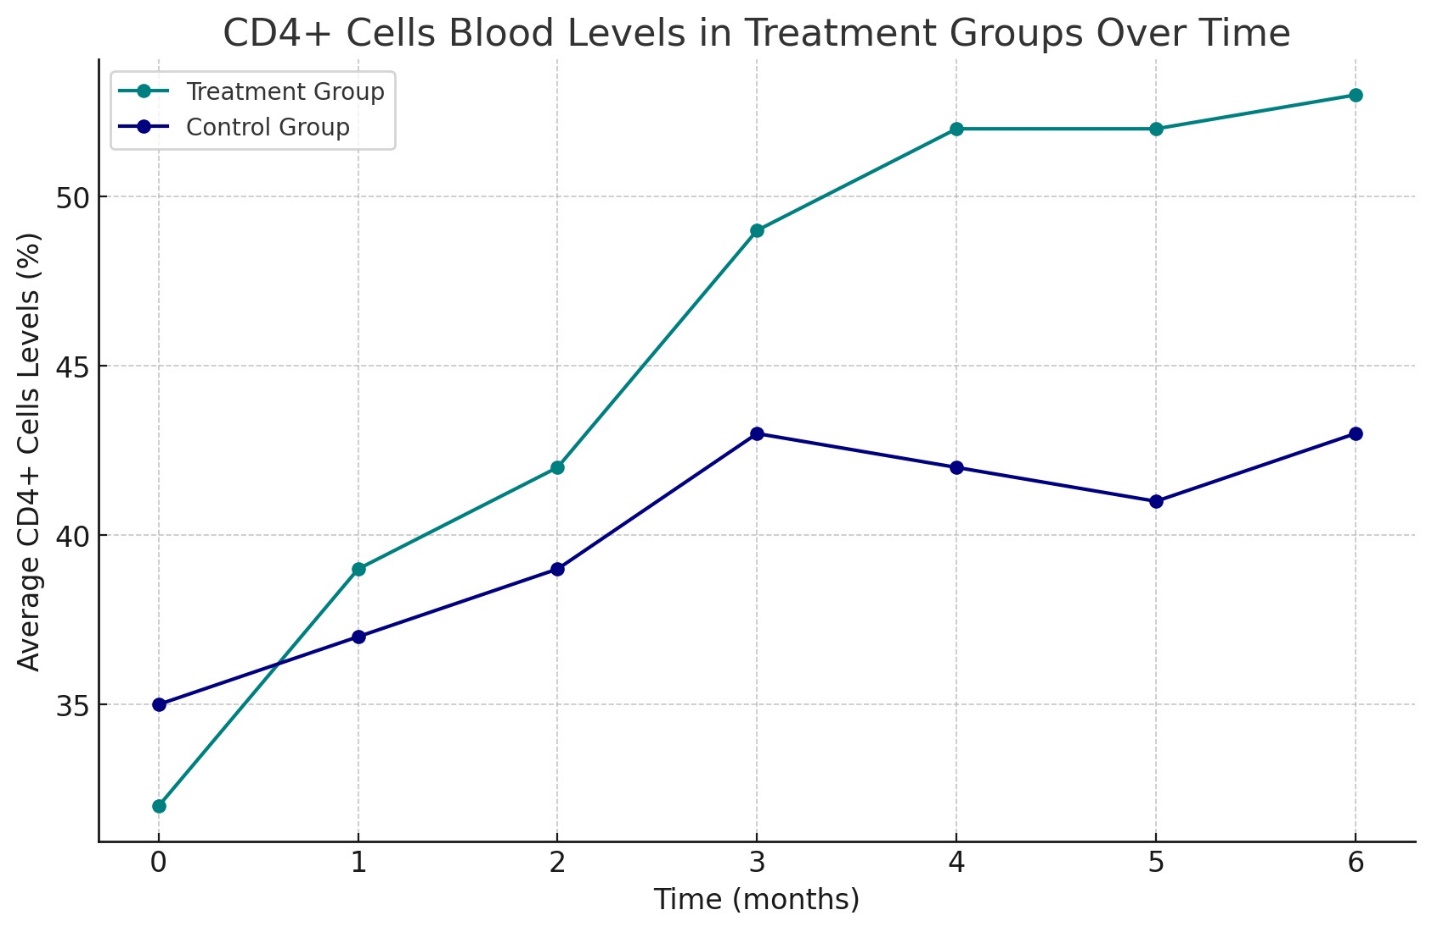
Graph N2: Illustrate the changes in immune cell populations
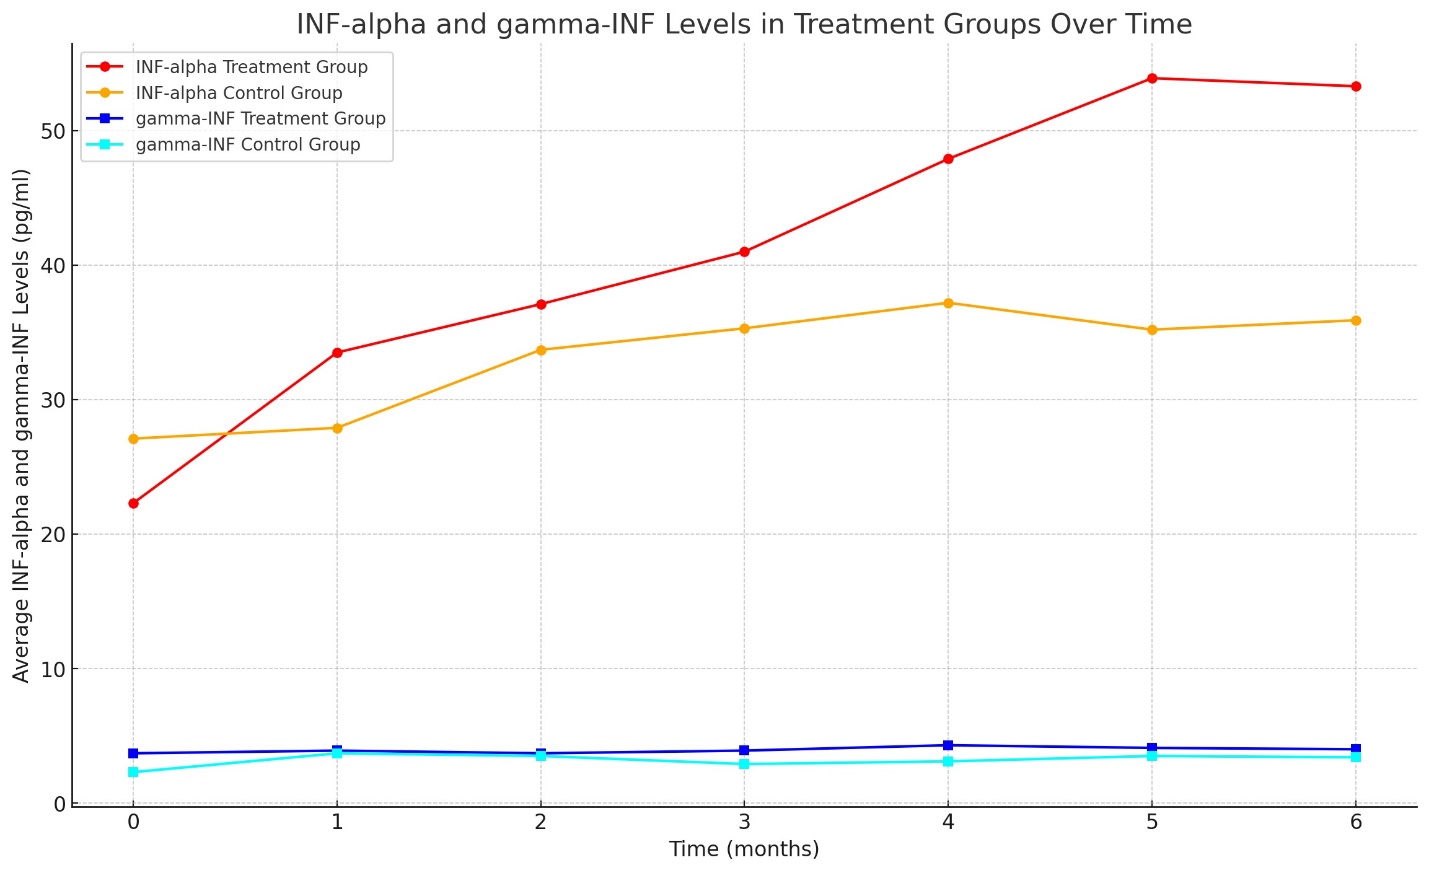
Graph N3: Summarizes the interferon response levels
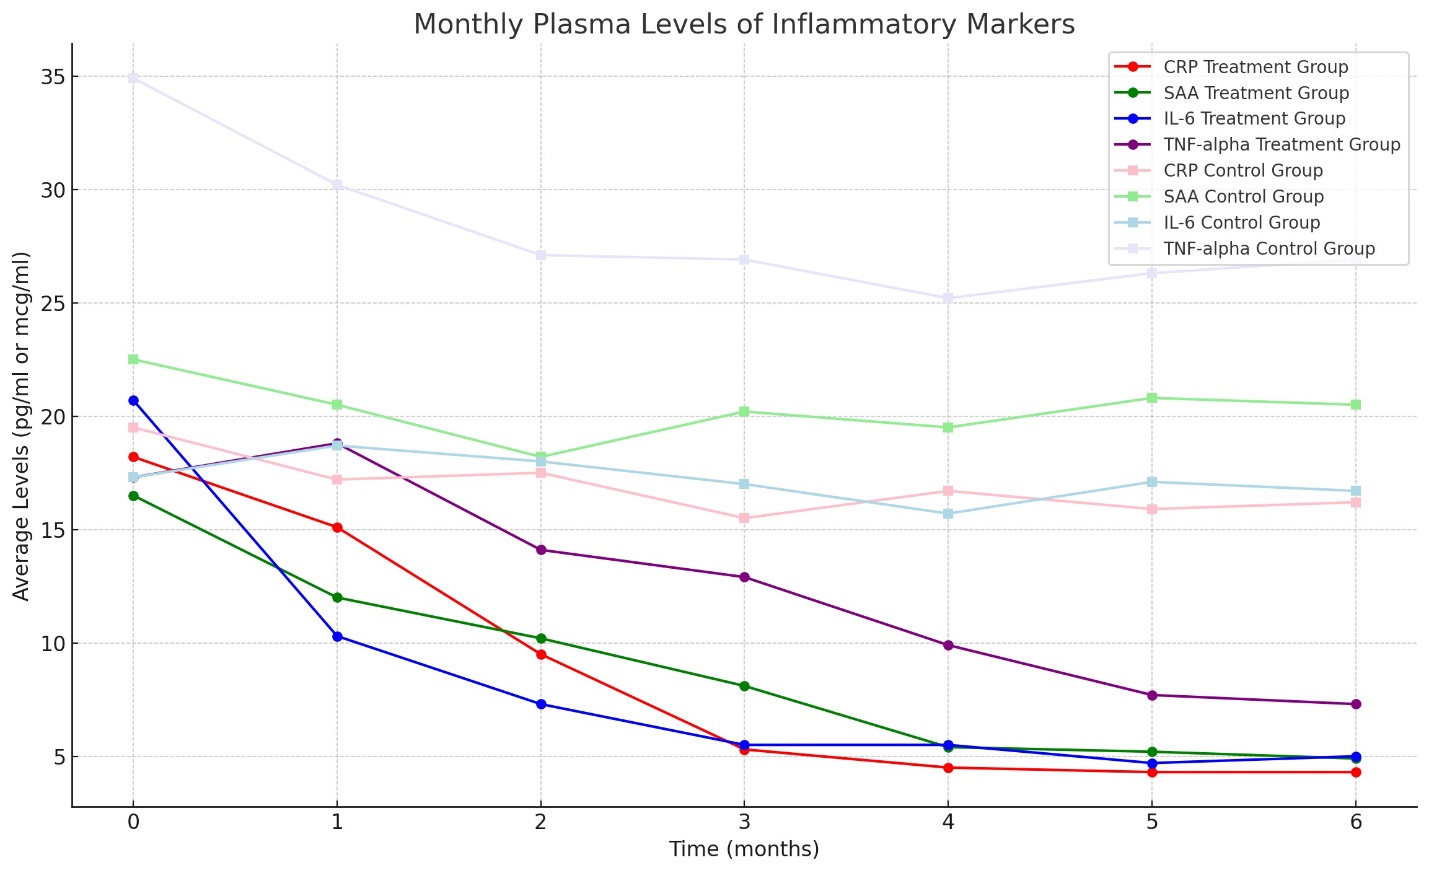
Graph N4: The immune response (The inflammatory markers changes) trajectory over the treatment course
Tables at a glance
Figures at a glance