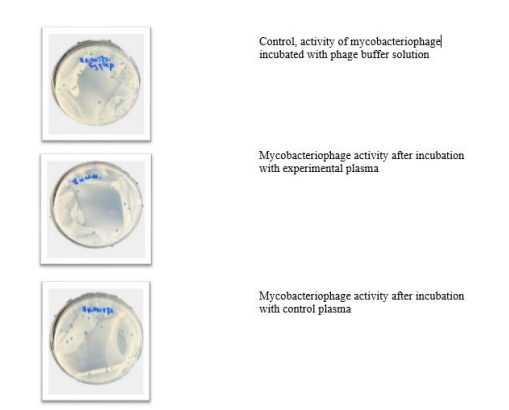
Figure 1: Representative images of mycobacteriophage D29 PFU on a solid nutrient medium with M.smegmatis after incubation with animal plasma after a 20-day administration of the liposomal bacteriophage preparation.
Figure 1: Representative images of mycobacteriophage D29 PFU on a solid nutrient medium with M.smegmatis after incubation with animal plasma after a 20-day administration of the liposomal bacteriophage preparation.
Tables at a glance
Figures at a glance