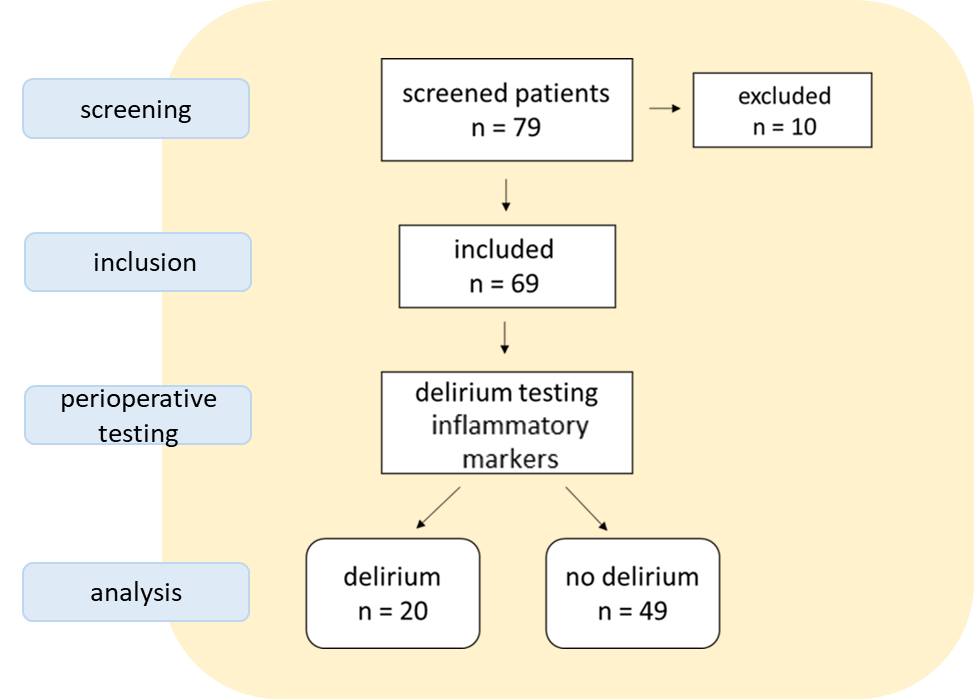
Figure 1: Screening/allocation procedure. N=number of patients in each group
Figure 1: Screening/allocation procedure. N=number of patients in each group
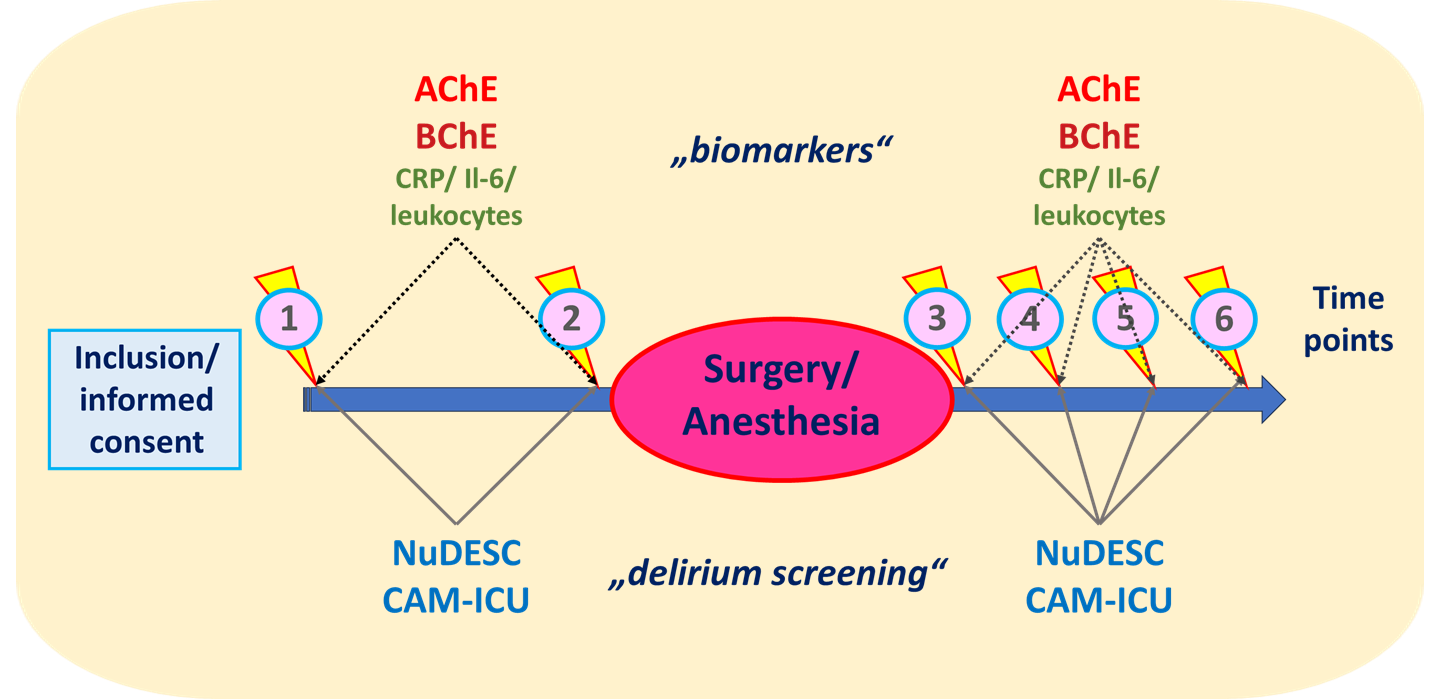
Figure 2: Overview of the perioperative measures carried out (Nu-DESC = Nursing Delirium Screening Scale; CAM-ICU = confusion assessment method for the intensive care unit; AChE = acetylcholinesterase; BChE = butyrylcholinesterase; CRP = c-reactive protein; Il-6 = interleukin 6; 1-6: perioperative time points
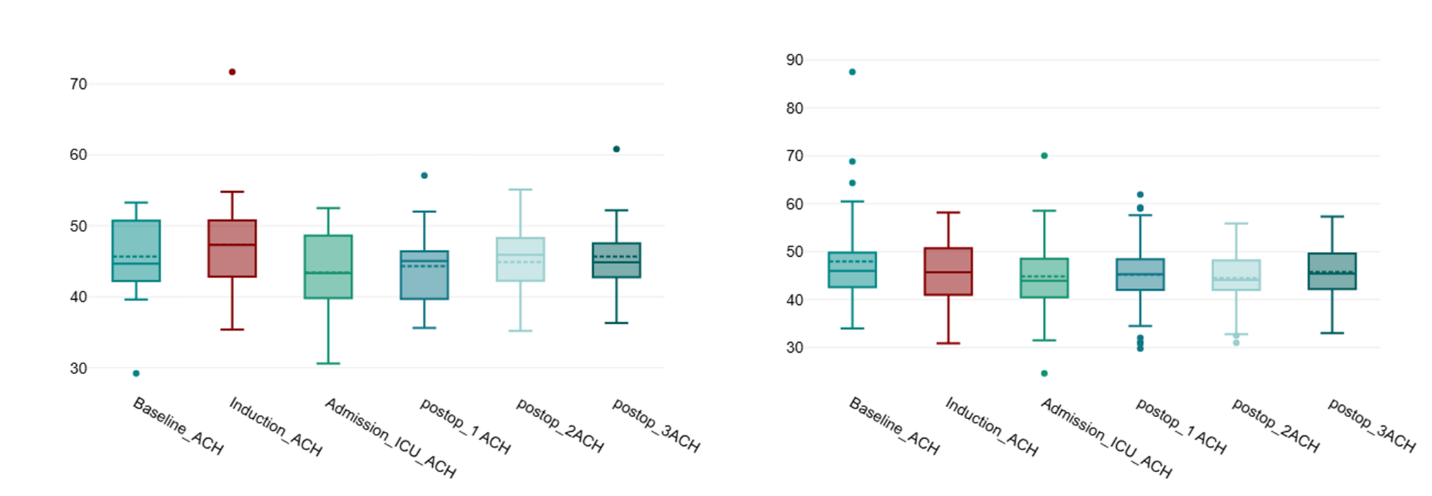
Figure 3: Boxplots of perioperative course of AChE (acetylcholinesterase in U/g Hb [units per gram hemoglobin]) in delirious (left diagram) and non-delirious (right diagram) patients. postop 1-3 = postoperative days 1-3; ICU = intensive care unit; induction = anesthesia induction). Displayed are mean differences (mean values; upper & lower quantile & extremes [dots]). Average differences between patients with and without delirium: hospital admission: -2/ before anesthesia: 1/ admission Intensive Care Unit: -2/ 1st postoperative day: -1/ 2nd postoperative day: 0.5/ 3rd postoperative day: 0
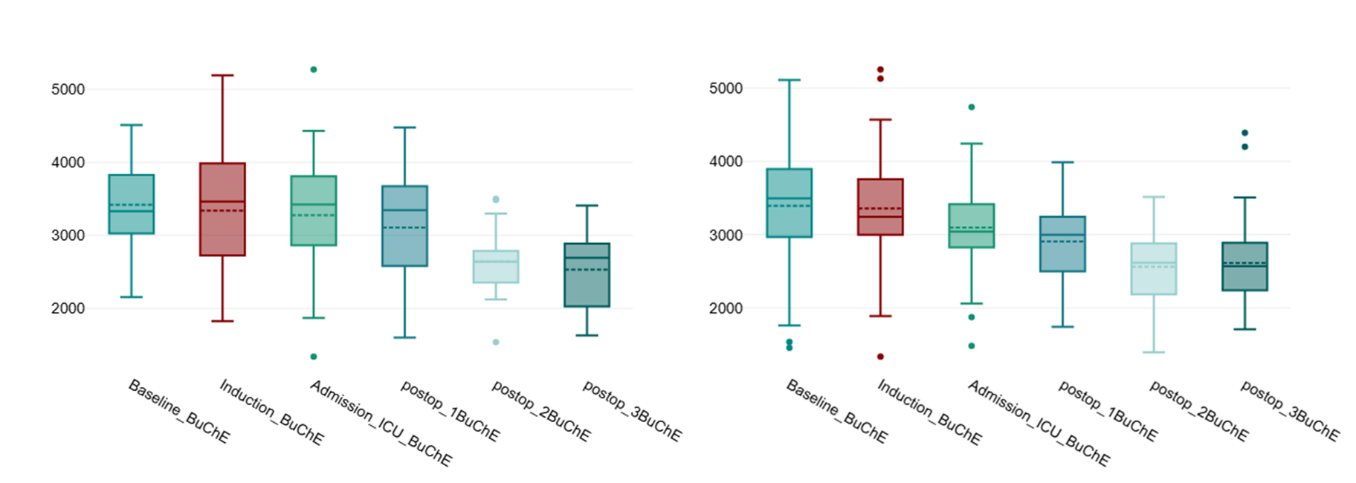
Figure 4: Boxplots of perioperative course of BChE (butyrylcholinesterase in U/l [units per litre]) in delirious (left diagram) and non-delirious (right diagram) patients. postop 1-3 = postoperative days 1-3; ICU = intensive care unit; induction = anesthesia induction). Displayed are mean differences (mean values; upper & lower quantil & extremes [dots]). Average differences between patients with and without delirium: hospital admission: 26/ before anesthesia: 17/ admission Intensive Care Unit: 180/ 1st postoperative day: 199/ 2nd postoperative day: 78/ 3rd postoperative day: 85
Tables at a glance
Figures at a glance