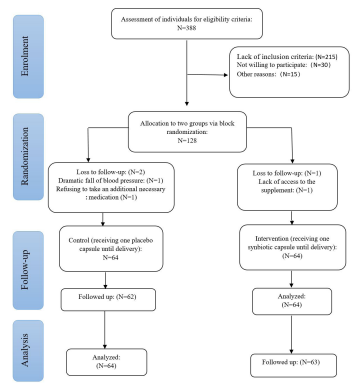
Figure 1:The CONSORT diagram of the study
|
Features |
Synbiotic (n=64) |
Placebo (n=64) |
P |
|
|
Age (years) |
28.9 (4.8) |
27.9 (4.5) |
0.589† |
|
|
Pre-pregnancy weight (Kg) |
75.54 (7.6) |
74.64 (7.8) |
0.511† |
|
|
Height (m) |
1.62 (0.0) |
1.63 (0.0) |
0.713† |
|
|
Gestational age at the time of |
208.68 (27.8) |
213.39 (22.3) |
0.293† |
|
|
|
N (%) |
N (%) |
|
|
|
BMI (Kg/m2) |
<18.5 |
20 (31.3) |
12 (18.8) |
0.159€ |
|
18.5-24.9 |
5 (7.8) |
6 (9.4) |
||
|
25-29.9 |
39 (60.9) |
12 (18.8) |
||
|
Educational level |
Lower than diploma |
32 (50.0) |
36 (56.3) |
0.892‡ |
|
High school diploma |
29 (45.3) |
20 (31.3) |
||
|
Academic |
3 (4.7) |
8 (12.5) |
||
|
Spouse’s educational level |
Lower than diploma |
34 (53.1) |
33 (51.6) |
0.457‡ |
|
High school diploma |
24 (37.5) |
20 (31.3) |
||
|
Academic |
6 (9.4) |
11 (17.2) |
||
|
Residency |
Urban regions |
43 (67.2) |
45 (70.3) |
0.849€ |
|
Rural regions |
21 (32.8) |
19 (29.7) |
||
|
Occupation |
Housewife |
57 (89.1) |
57 (89.1) |
0.224† |
|
Employed |
7 (10.9) |
7 (10.9) |
||
|
Household income |
Adequate |
42 (65.6) |
45 (70.3) |
0.426‡ |
|
Inadequate |
22 (34.4) |
19 (29.7) |
||
|
Positive history of preeclampsia |
15 (23.4) |
7 (10.9) |
0.100€ |
|
|
Positive history of gestational diabetes |
15 (23.4) |
6 (9.4) |
0.054€ |
|
|
Vit D consumption |
52 (81.3) |
31 (48.4) |
0.001€ < |
|
|
Number of |
Nulliparous |
28 (43.8) |
20 (31.3) |
0.201€ |
|
Multiparous |
36 (56.3) |
44 (68.8) |
||
|
Previous deliveries |
No previous delivery |
40 (62.5) |
26 (40.6) |
0.054§ |
|
Natural delivery |
16 (24.2) |
25 (39.1) |
||
|
Cesarean section |
8 (13.3) |
13 (20.3) |
||
|
History of abortion |
16 (25.6) |
14 (21.8) |
0.612€ |
|
|
living child |
15 (23.4) |
22 (34.3) |
0.809€ |
|
|
Preeclampsia |
Early (<34 weeks) |
50 (49.5) |
51 (50.4) |
0.828§ |
|
Late (≥34 weeks) |
14 (51.8) |
13 (48.1) |
||
Table 1: values rpruent means (SD) independnet I-test. l: Chi-square for trend, exact test, S: an-square BNII: boclv mass index
Maternal outcomes |
Synbiotic (n=64) |
Placebo (n=64) |
Adjusted mean difference/ (95% Cl) |
P-value |
|
Duration of pregnancy (days)* |
232.00 (20.78) |
232.60 (21.20) |
-1.99 (-9.88 to 5.89) |
0.618± |
|
Time from PE diagnosis to delivery (days)* |
21.59 (24.03) |
19.21 (17.29) |
3.34 (-4.50 to 11.95) |
0.401± |
|
Systolic blood pressure* |
pre-intervention |
134.07 (9.08) |
134.67 (8.81) |
0.59 (-2.53 to 3.72) |
0.708† |
post-intervention |
138.15 (25.85) |
153.64 (22.86) |
-13.54 (-22.07 to -5.01) |
0.002± |
|
Diastolic blood |
pre-intervention |
83.12 (7.37) |
83.34 (5.10) |
0.21 (-2.00 to 2.44) |
0.846† |
post-intervention |
83.23 (18.12) |
95.01 (12.45) |
-10.30 (-15.90 to -4.70) |
0.001± < |
|
|
N (%) |
N (%) |
Adjusted odds ratio (95% CI) |
P-value |
|
Incidence of severe preeclampsia** |
28 (43.8) |
49 (76.6) |
5.01 (2.04 to 12.29) |
0.001 <ౠ|
|
Premature rupture of membranes** |
9 (14.1) |
4 (6.3) |
0.31 (0.79 to 1.21) |
0.093ౠ|
|
Vaginal delivery** |
33 (36.19) |
32 (25.78) |
0.95 (0.37 to 2.40) |
0.920ౠ|
|
Incidence of serious complications (cerebral stroke, renal failure, HELLP |
7 (11.9) |
4 (6.3) |
1.48 (0.30 to 7.24) |
0.627ౠ|
|
Use of antihypertensive drugs** |
53 (82.8) |
59 (92.2) |
1.44 (0.43 to 4.82) |
0.553ౠ|
|
Table 2:The comparison of maternal outcojnes between the synbiotic.supplemented and placebo groups
*symbol represents mean (standard deviation) ** symbol represents frequency (percentage) † ANCOVA, ‡ logistic regression, ± adjusted for vitamin D3 consumption
Biochemical factors |
Synbiotic (n=64) |
Placebo (n=64) |
Adjusted mean difference |
P |
|
Platelet count (count/ml) |
Pre-intervention |
211265.62 |
212421.87 |
1156.25 (-19892.91 to 22205.41) |
0.914† |
Post-intervention |
185785 (7004) |
190789 (6943) |
-5004.56 (-25533.69 to 15524.55) |
0.630‡ ± |
|
Creatinine |
Pre-intervention |
0.82 (0.16) |
0.80 (0.12) |
-0.02 ()-0.07 to 0.02 |
0.350† |
Post-intervention |
0.79 (0.01) |
0.86 (0.01) |
-0.06 (-0.11 to -0.02) |
0.005‡ ± |
|
LDH (u/L) |
Pre-intervention |
385.29 (99.84) |
370.98 (94.23) |
-14.31 (-50.88 to 22.25) |
0.439† |
Post-intervention |
441.50 (17.99) |
405.9 (18.17) |
35.51 (-17.73 to 88.76) |
0.189‡ ± |
|
Random proteinuria (mg) |
Pre-intervention |
2.07 (1.23) |
2.10 (1.00) |
0.30 (-0.36 to 0.42) |
0.881† |
Post-intervention |
1.64 (1.22) |
1.92 (1.07) |
-0.47 (-0.92 to 0.01) |
0.044‡ ± |
|
ALT (u/L) |
Pre-intervention |
19.51 (12.67) |
15.76 (11.22) |
-2.47 (6.73 to 1.77) |
0.252† |
Post-intervention |
22.70 (22.72) |
15.57 (9.80) |
4.91 (-3.07 to 12.91) |
0.225‡ ± |
|
AST (u/L) |
Pre-intervention |
20.34 (10.26) |
19.02 (6.81) |
-0.38 (-3.78 to 3.02) |
0.824† |
Post-intervention |
23.29 (14.24) |
20.95 (16.92) |
1.27 (-5/68 to 8.22) |
0.717‡ ± |
|
Table 3:The comparison of sonle biochemical factors before and atter the intervent ion between the svnbiotic and placebo groups
NI data bave been described as mean {standard deviation} ANCOVA, *independent t-test, ± adjusted for litamin D3 oonsumption
Figure 1:The CONSORT diagram of the study
Tables at a glance
Figures at a glance