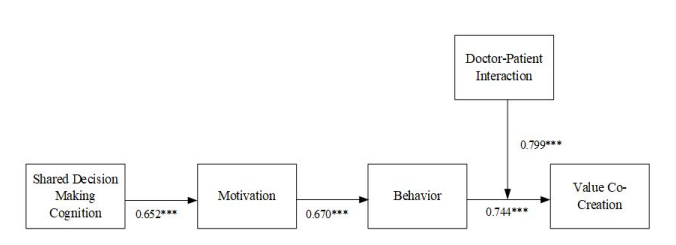
figure:1 Path analysis
Characteristics |
Female |
Male |
pa |
||
|
n |
% |
n |
% |
|
Total |
116 |
67.1 |
57 |
32.9 |
|
Age(years) |
|
|
|
|
0.63 |
18~34 |
33 |
19.1 |
14 |
8.1 |
|
35~44 |
43 |
24.9 |
18 |
10.4 |
|
45~54 |
28 |
16.2 |
19 |
11 |
|
>55 |
12 |
6.9 |
6 |
3.5 |
|
Education level |
|
|
|
|
0.924 |
Senior high school |
9 |
5.2 |
4 |
2.3 |
|
Junior college |
19 |
11 |
9 |
5.2 |
|
University |
61 |
35.3 |
28 |
16.2 |
|
Graduate school |
27 |
15.6 |
16 |
9.2 |
|
Marriage status |
|
|
|
|
0.354 |
Single |
32 |
18.5 |
18 |
10.4 |
|
Married |
84 |
48.6 |
39 |
22.5 |
|
Last visit to the department |
|
|
|
|
0.18 |
Department of Internal Medicine |
43 |
24.9 |
23 |
13.3 |
|
Department of Surgery |
9 |
5.2 |
9 |
5.2 |
|
Others |
64 |
37 |
25 |
14.5 |
|
Table: Sample characteristics (n=173).
a There were significant differences ( < 0.001) in all variables of patients' characteristics among enrollee, potential enrollee, and comparison groups. The statistical difference was calculated by the test for categorical variables and by the t test for continuous variables.
Construct |
Dimension |
Item |
Factor loading |
SMC |
CR |
AVE |
SDM Cognition |
Knowledge |
A3 |
0.792 |
0.627 |
0.861 |
0.609 |
A4 |
0.807 |
0.651 |
||||
A5 |
0.725 |
0.526 |
||||
A6 |
0.794 |
0.63 |
||||
Attitude |
A7 |
0.775 |
0.6 |
0.892 |
0.733 |
|
A8 |
0.687 |
0.472 |
||||
A9 |
0.822 |
0.676 |
||||
A10 |
0.845 |
0.714 |
||||
A11 |
0.863 |
0.744 |
||||
A12 |
0.86 |
0.74 |
||||
Motivation |
Inner |
B1 |
0.724 |
0.524 |
0.86 |
0.553 |
B2 |
0.727 |
0.529 |
||||
B3 |
0.833 |
0.694 |
||||
B9 |
0.629 |
0.396 |
||||
B10 |
0.79 |
0.624 |
||||
External |
B4 |
0.734 |
0.539 |
0.88 |
0.552 |
|
B5 |
0.761 |
0.579 |
||||
B6 |
0.82 |
0.672 |
||||
B7 |
0.83 |
0.689 |
||||
B8 |
0.676 |
0.457 |
||||
B11 |
0.614 |
0.377 |
||||
Behavior of Engagement |
Information seeking |
C1 |
0.858 |
0.736 |
0.882 |
0.557 |
C2 |
0.836 |
0.699 |
||||
C13 |
0.71 |
0.504 |
||||
C14 |
0.716 |
0.513 |
||||
C15 |
0.715 |
0.511 |
||||
C16 |
0.616 |
0.379 |
||||
Information sharing |
C3 |
0.652 |
0.425 |
0.745 |
0.495 |
|
C4 |
0.668 |
0.446 |
||||
C5 |
0.671 |
0.45 |
||||
C9 |
0.834 |
0.696 |
||||
C10 |
0.727 |
0.529 |
||||
C11 |
0.758 |
0.575 |
||||
C12 |
0.617 |
0.381 |
||||
Interaction |
Doctor-patient relationship |
D1 |
0.885 |
0.784 |
0.928 |
0.685 |
D2 |
0.91 |
0.827 |
||||
D3 |
0.801 |
0.641 |
||||
D4 |
0.727 |
0.529 |
||||
D5 |
0.816 |
0.666 |
||||
D6 |
0.813 |
0.66 |
||||
Doctor-patient Communication |
D7 |
0.896 |
0.803 |
0.765 |
0.528 |
|
D8 |
0.615 |
0.378 |
||||
D9 |
0.635 |
0.404 |
||||
Value co-creation |
Personal value |
E1 |
0.77 |
0.593 |
0.876 |
0.586 |
E2 |
0.794 |
0.63 |
||||
E3 |
0.809 |
0.654 |
||||
E4 |
0.722 |
0.521 |
||||
E5 |
0.729 |
0.531 |
||||
Collective value |
E6 |
0.674 |
0.454 |
0.895 |
0.551 |
|
E7 |
0.743 |
0.552 |
||||
E8 |
0.699 |
0.489 |
||||
E9 |
0.734 |
0.539 |
||||
E10 |
0.768 |
0.59 |
||||
E11 |
0.839 |
0.704 |
||||
E12 |
0.726 |
0.527 |
Table:2 Assessment of convergent and discriminant validity
Construct |
Dimension |
Mean |
SD |
Cronbach's α |
SDM Cognition |
(A) Knowledge |
438 |
.593 |
.863 |
(B) Attitude |
4.36 |
.605 |
.937 |
|
Motivation |
(C) Inner |
4.28 |
.581 |
.859 |
(D) External |
3.70 |
.773 |
.884 |
|
Behavior |
(E) Information seeking |
4.35 |
.520 |
.904 |
(F) Information sharing |
4.17 |
.585 |
.901 |
|
Interaction |
(G)Doctor-patient relationship |
4.20 |
.567 |
.950 |
(H)Doctor-patient Communication |
4.13 |
.562 |
.700 |
|
Value co-creation |
(I) Personal value |
4.30 |
.523 |
.921 |
(J) Collective value |
4.85 |
.666 |
.944 |
Table:3 Reliability analysis
Construct |
A |
B |
C |
D |
E |
F |
G |
H |
I |
J |
|
SDM |
A |
.780 |
|
|
|
|
|
|
|
|
|
B |
.705*** |
.856 |
|
|
|
|
|
|
|
|
|
Motivation |
C |
.665*** |
.744*** |
.730 |
|
|
|
|
|
|
|
D |
.414*** |
.503*** |
.675*** |
.742 |
|
|
|
|
|
|
|
Behavior |
E |
.574*** |
.557*** |
.605*** |
.460*** |
.746 |
|
|
|
|
|
F |
.577*** |
.567*** |
.678*** |
.568*** |
.731*** |
.703 |
|
|
|
|
|
Interaction |
G |
.468*** |
.567*** |
.621*** |
.452*** |
.641*** |
.654*** |
.827 |
|
|
|
H |
.467*** |
.520*** |
.556*** |
.551*** |
.614*** |
.672*** |
.689*** |
..726 |
|
|
|
Value co- creation |
I |
.577*** |
.665*** |
.648*** |
.489*** |
.681*** |
.655*** |
.641*** |
.684*** |
.765 |
|
J |
.562*** |
.704*** |
.711*** |
.583*** |
.650*** |
.692*** |
.608*** |
.704*** |
.889*** |
.742 |
|
Table:4 Correlation matrix of variables
1. The bold numbers on the diagonal are the square root value of AVE, while numbers off the diagonal are the correlation coefficient of corre- sponding constructs.
2. The AVE square root of each construct must be greater than the correlation coefficient of corresponding constructs.
3. *** p< 0.001
figure:1 Path analysis
Tables at a glance
Figures at a glance