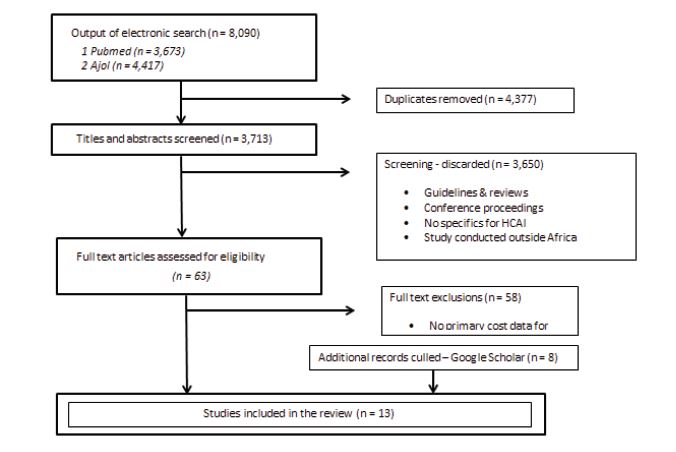
Figure 1: Study Selection Procedure
Figure 1: Study Selection Procedure
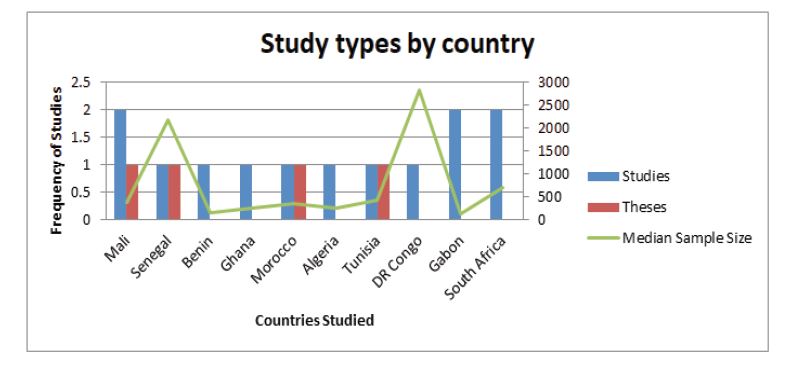
Figure 2: Study types & sample sizes across countries
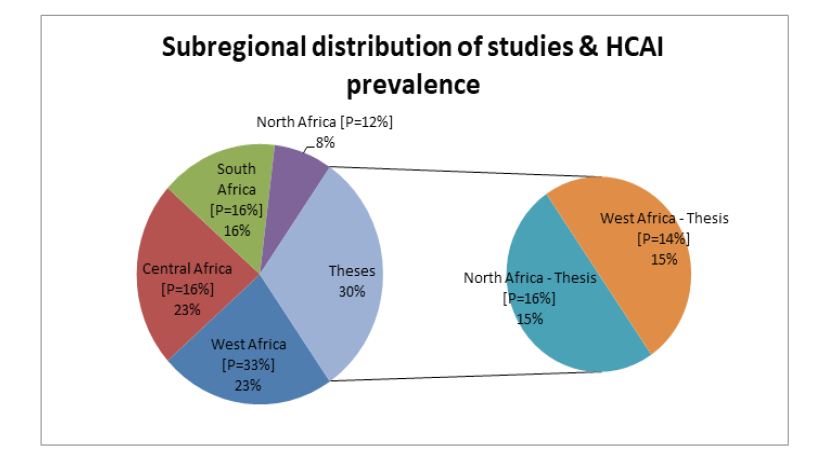
Figure 3: Sub regional distribution of studies & prevalence [P]
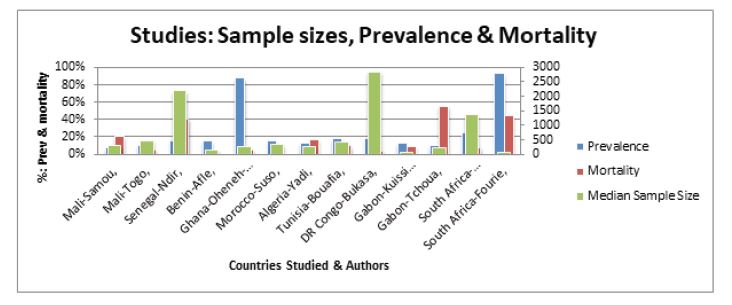
Figure 4: Prevalence & Mortality
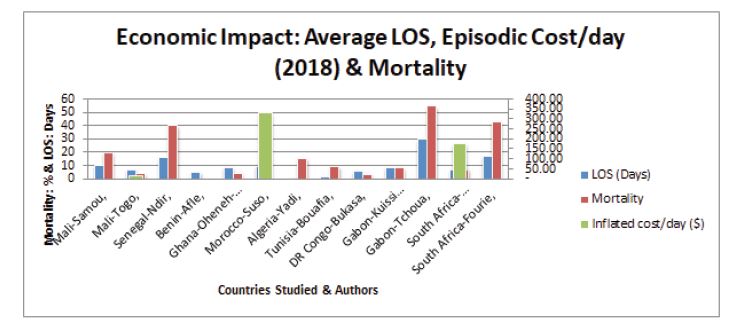
Figure 5: Economic Impact - Average LOS, Mortality & Daily Cost
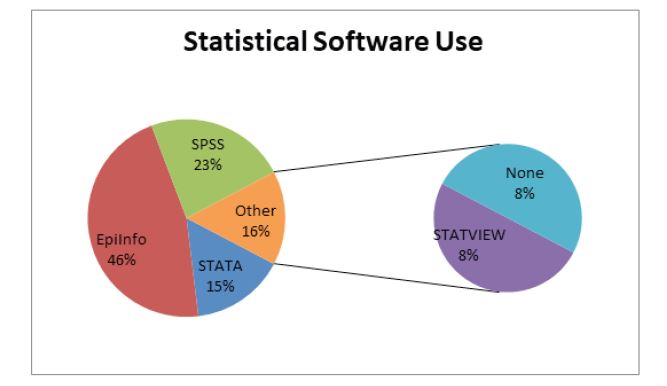
Figure 6: Statistical software use
Tables at a glance
Figures at a glance