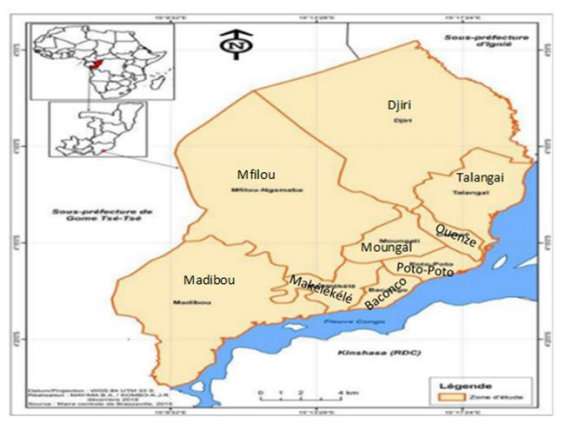
Figure 1: Brazzaville city localisation, study area circumscriptions
Variables |
Participants N=175 |
S.aureuscolonisation |
|
Positive %(N=39) |
Negative%(N=136) |
||
Age group by years (Median [IQ]) |
(26 [23-29]) |
-- |
-- |
18-28 |
129 |
20 (26) |
80 (103) |
29-39 |
25 |
28 (7) |
72 (18) |
≥40 |
21 |
29 (6) |
71 (15) |
Sex |
|
||
M |
140 |
20 (28) |
80 (112) |
F |
35 |
31 (11) |
69 (24) |
Location |
|
||
Area 1 |
89 |
21 (19) |
79 (70) |
Area 2 |
74 |
24 (18) |
76 (56) |
Area 3 |
12 |
17 (2) |
83 (10) |
Table 1Socio-demographic characteristics of the study Congolese population and the prevalence of S. aureus colonization
Variables |
All participants |
S. aureuscolonisation% (n) |
OR (95% CI) |
P-value |
Age (years) |
|
|||
18-28 |
129 |
20 (26) |
Reference |
- |
29-39 |
25 |
28 (7) |
1.54 (0.602-3.89) |
0.425 |
≥40 |
21 |
29 (6) |
1.58 (0.55- 4.36) |
0.394 |
Sex |
|
|||
M |
140 |
20 (28) |
Reference |
- |
F |
35 |
31.4 (11) |
1.83 (0.83 – 4.24) |
0.173 |
Smoking |
|
|||
No |
166 |
23 (38) |
Reference |
- |
Yes |
9 |
11 (1) |
0.42 (0.05-3.47) |
0.421 |
Antibiotics consumption within last three months |
|
|||
No |
112 |
22 (25) |
Reference |
- |
Yes |
63 |
22 (14) |
1.22 (0.58-2.55) |
0.592 |
Contact with animal |
|
|||
No |
145 |
25 (36) |
Reference |
- |
Yes |
30 |
10 (3) |
0.33 (0.09-1.17) |
0.08 |
Contact with bush meat |
|
|||
No |
168 |
21 (36) |
Reference |
- |
Yes |
7 |
43 (3) |
2.75 (0.58-12.8) |
0.198 |
Table-2: Evaluation of risk factors associated to S. aureus colonization.
Antibiotics |
PVL+ (n=9) |
PVL- (n=30) |
Total (n=39)n (%) |
||
mecA+ (MRSA) (n=2) |
mecA- (MSSA) |
mecA+ (MRSA) (n=2) |
mecA-(MSSA) (n=28) |
||
AZM |
0 |
0 |
0 |
8 (29%) |
8 (21%) |
FOX |
0 |
2 (29%) |
1 (50%) |
3 (11%) |
6 (15%) |
E15 |
0 |
0 |
0 |
8 (29%) |
8 (21%) |
TGC |
0 |
0 |
0 |
0 |
0 |
LZD |
0 |
1 (14%) |
0 |
6 (21%) |
7 (18%) |
VA |
0 |
0 |
0 |
5 (18%) |
5 (13%) |
Table 3: Antibiotic resistance rate and virulence expression of S. aureus strains.
Antibiotics |
Overall rate of S. aureusresistance % (n) |
Resistance rate of strains from antibiotics users within the last 3 months % (n) |
Resistance rate of strains from non-antibiotic users in the last 3 months % (n) |
P. Value |
|
AZM |
21 (8/39) |
50 (4/8) |
50 (4/8) |
1.00 |
|
FOX |
15 (6/39) |
50 (3/6) |
50 (3/6) |
1.00 |
|
E15 |
21 (8/39) |
38 (3/8) |
62 (5/8) |
0.80 |
|
TGC |
0 |
0 |
0 |
-- |
|
LZD |
18 (7/39) |
0 |
100 (7/7) |
0.001* |
|
VA |
13 (5/39) |
0 |
100 (5/5) |
0.001* |
|
Table-4: Resistance rate between antibiotics users and non-users.
Figure 1: Brazzaville city localisation, study area circumscriptions
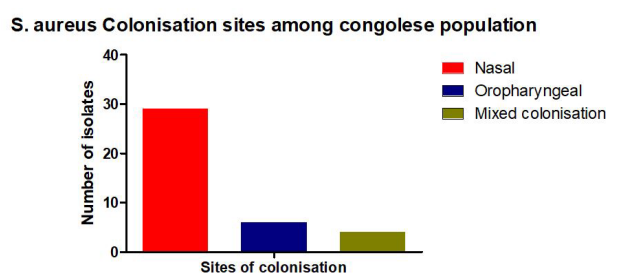
Figure 2: S. aureus colonization prevalence by collection site, in the 39 patients who were found to be positive.
Tables at a glance
Figures at a glance