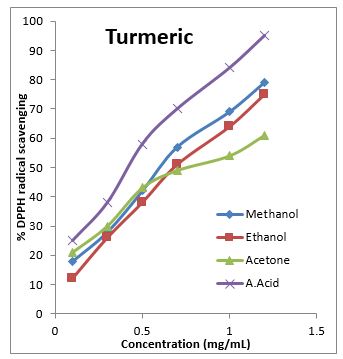
Figure 1: inhibition (%) of turmeric
Sample type IC50 values (mg/mL) of DPPH radical scavenging |
Methanol Ethanol Acetone |
Turmeric 0.654 |
Coriander 0.545±0.172 2.021±0.520 0.555± 1.302 |
Fenugreek 0.556±0.210 1.273 ±1.320 0.618±0.403 |
Ascorbic acid 0.445±0.125 0.447±0.941 0.446±0.372 |
Table 4: IC50 value of DPPH radical scavenging ability of extracts
Figure 1: inhibition (%) of turmeric
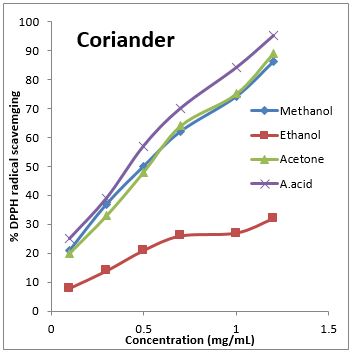
Figure 2: inhibition (%) of coriander
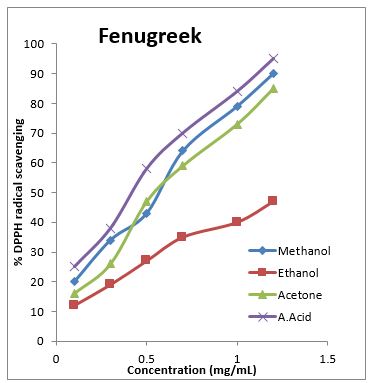
Figure 3: Inhibition (%) of fenugreek
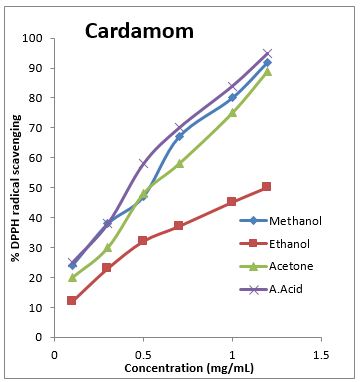
Figure 4: inhibition (%) of cardamom
Tables at a glance
Figures at a glance