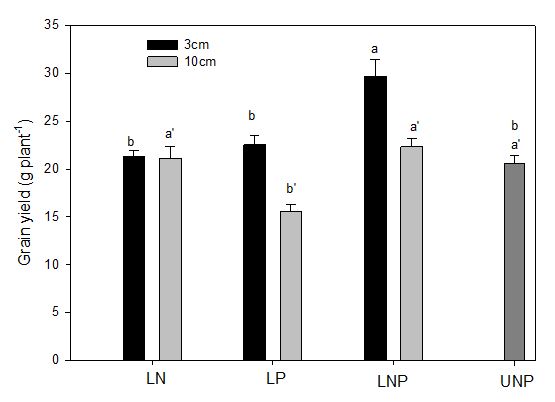
Figure 1: Rice grain yield responses at maturity to (i) different combinations of N and P, and (ii) placement location. Within nutrient placement levels (3 cm or 10 cm placement), lower-case letters identify significant differences between nutrient combinations (P < 0.05). LN, localised N-only supply; LP, localised P-only supply; LNP, localised NP together supply; UNP, uniform NP supply
Tables at a glance
Figures at a glance