Figure 1: Monthly (figure above) and yearly change (figure below) of precipitation with time in the semiarid regions of Loess planteau,Guyuan, China
Figure 1: Monthly (figure above) and yearly change (figure below) of precipitation with time in the semiarid regions of Loess planteau,Guyuan, China
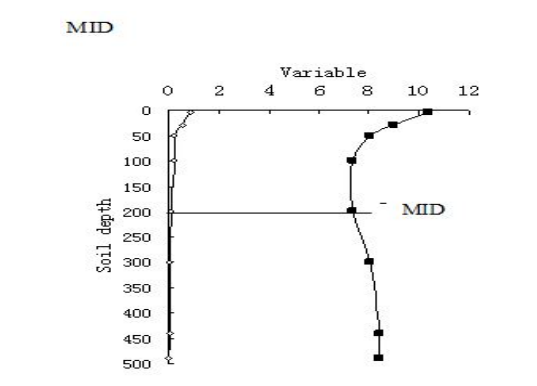
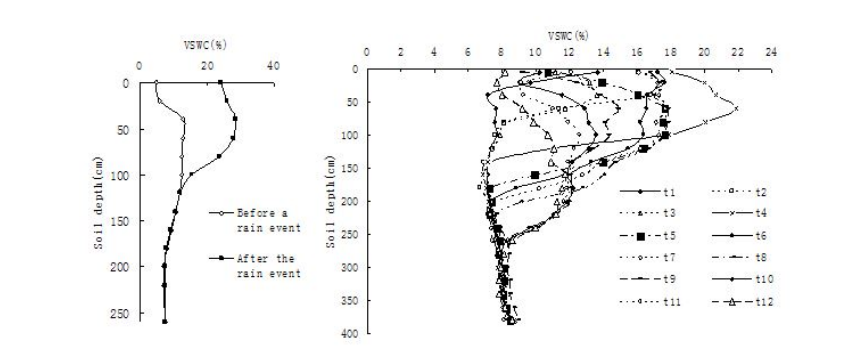
Figure 2: Two-curve method for estimating infiltration depth and maximal infiltration depth. a, infiltration depth and soil water supply for one rain event. b, the maximal infiltration depth is estimated by a series of two-curve methods in the semiarid loess hilly region, China. VSWC is volumetric soil water content
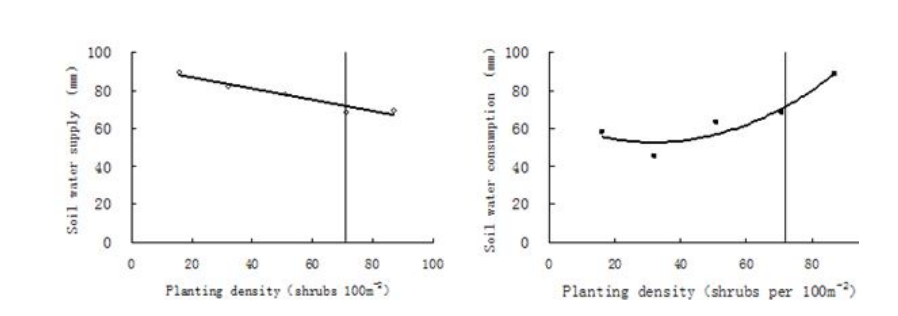
Figure 3: The change of root distribution depth (RDD) and wilting coefficient (WC) with soil depth in 16-year-old Caragana shrubland in the semiarid loess hilly region of China. MID is the maximal infiltration depth
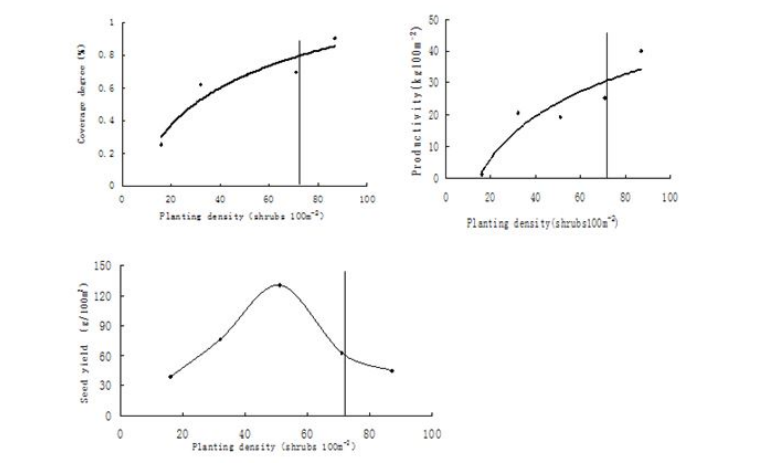
Figure 4: The changes in soil water supply and soil water consumption with planting density and SWVCC in the kay period of plant water relation regulation of Caragana shrubland in the semiarid loess hilly region, China. a, The change in soil water supply with planting density and SWVCC; b, The change in Soil water consumption with planting density and SWVCC
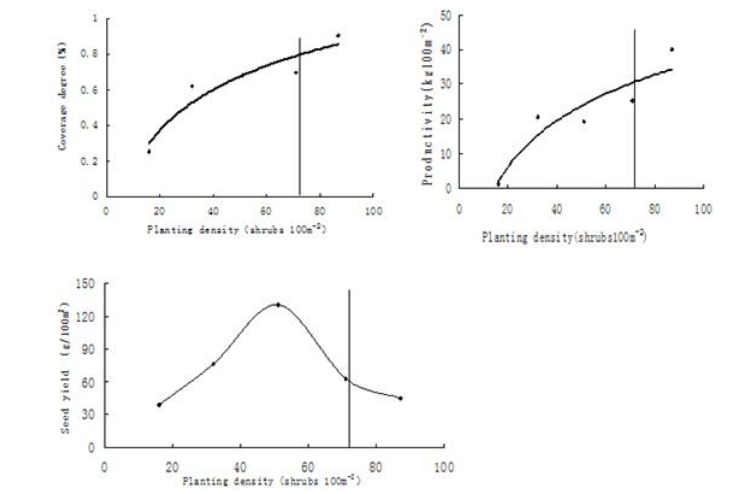
Figure 5: The change of coverage degree, productivity and seed yield with planting density and SWVCC in Caragana shrubland of the semiarid loess hilly region, China. a, The change in coverage degree with planting density and SWVCC. b, The change in Productivity with planting density and SWVCC. c, The change in seed yield with planting density and SWVCC
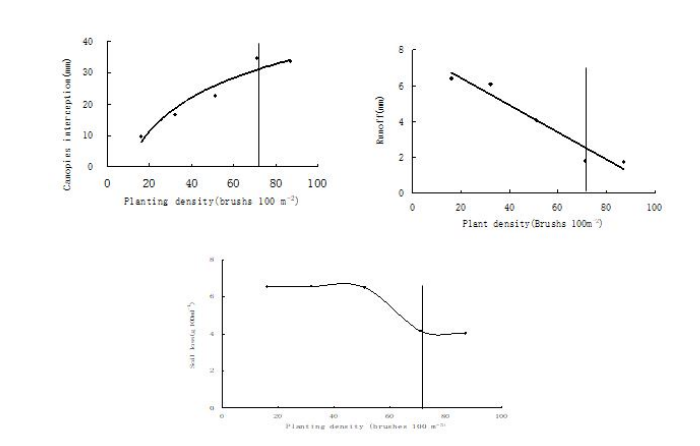
Figure 6: The Changes of canopy interception, runoff, and soil loss with planting density and SWVCC in the Caragana shrubland in the semiarid loess hilly region of China. a, The change in canopy interception with planting density and SWVCC; b, The change in runoff with planting density and SWVCC; c, The change in soil loss with planting density and SWVCC
Figures at a glance