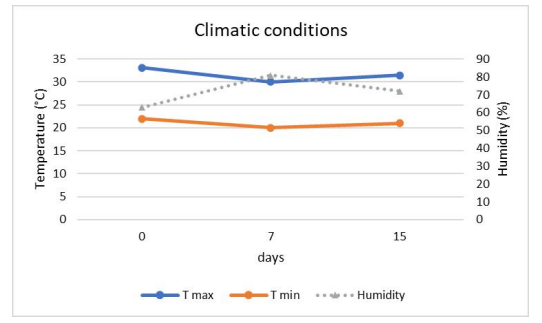
Figure 1: Greenhouse conditions during the growth cycle, maximum temperature (T max), minimum temperature (T min) and average relative humidity (%)
Figure 1: Greenhouse conditions during the growth cycle, maximum temperature (T max), minimum temperature (T min) and average relative humidity (%)
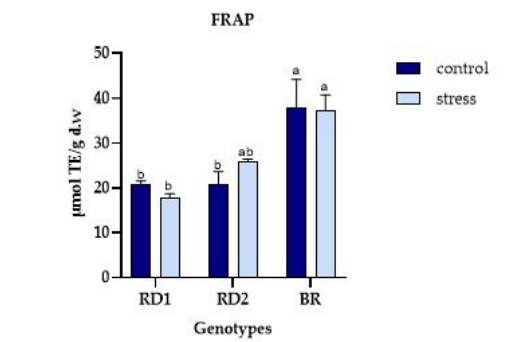
Figure 2: Variation of FRAP ( μmol TE/g d.w.) in microgreens of Broccolo nero (BR), Eruca sativa var. darkita (RD1) and Eruca sativa var. lobata (RD2). Each value represents the mean ± S.E. of three replicates. The letters above bars indicate significant differences according to Tukey's test (p < 0.05)
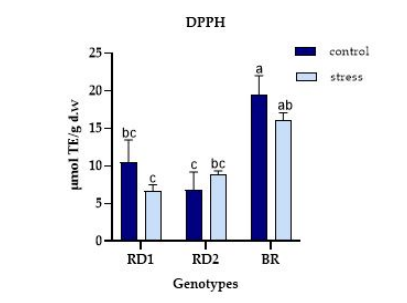
Figure 3: Variation of DPPH (μmol TE/g d.w.) in microgreens of Broccolo nero (BR), Eruca sativa var. darkita (RD1) and Eruca sativa var. lobata (RD2). Each value represents the mean ± S.E. of three replicates. The letters above bars indicate significant differences according to Tukey's test (p < 0.05)
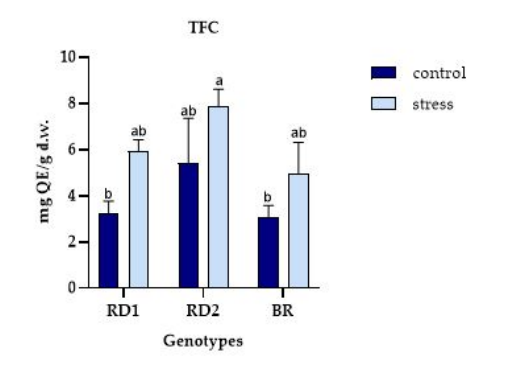
Figure 4: Variation of TFC (mg Quercetin Equivalents/g d.w.) in sprouts, microgreens, and baby leaves of Broccolo nero (BR), Eruca sativa var. darkita (RD1) and Eruca sativa var. lobata (RD2). Each value represents the mean ± S.E. of three replicates. The letters above bars indicate significant differences according to Tukey's test (p < 0.05)
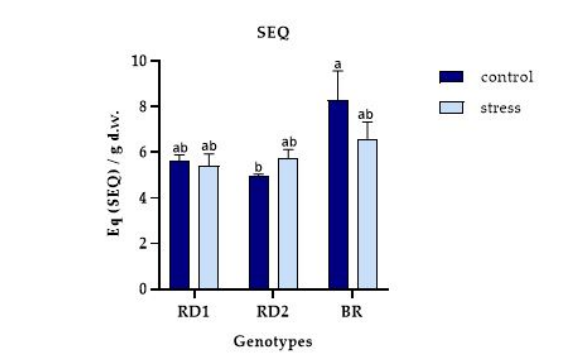
Figure 5: Total Glucosinolates (g SEQ/g d.w.) variation in microgreens of Broccolo nero (BR), Eruca sativa var. darkita (RD1) and Eruca sativa var. lobata (RD2). Each value represents the mean ± S.E. of three replicates. The letters above bars indicate significant differences according to Tukey's test (p < 0.05)

Figure 6: Variation of the Total sugars (g/1000 g d.w.) in microgreens of Broccolo nero (BR), Eruca sativa var. darkita (RD1) and Eruca sativa var. lobata (RD2). Each value represents the mean ± S.E. of three replicates. The letters above bars indicate significant differences according to Tukey's test (p < 0.05)
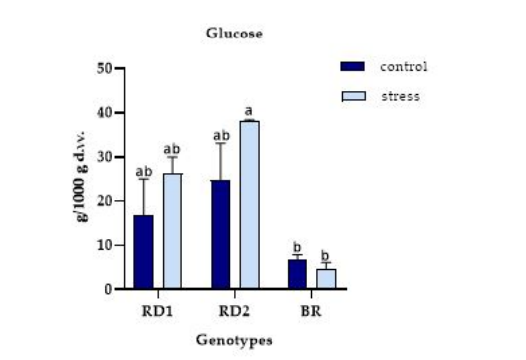
Figure 7: The variation of glucose (g/1000 g d.w.) in microgreens of Broccolo nero (BR), Eruca sativa var. darkita (RD1) and Eruca sativa var. lobata (RD2). Each value represents the mean ± S.E. of three replicates. The letters above bars indicate significant differences according to Tukey's test (p < 0.05)
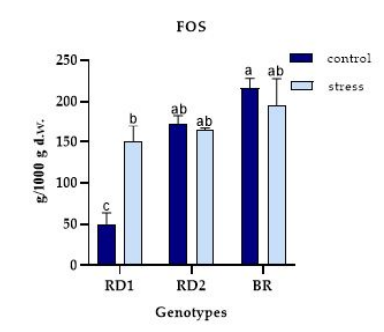
Figure 8: Variation of the FOS (g/1000 g d.w.) in microgreens of Broccolo nero (BR), Eruca sativa var. darkita (RD1) and Eruca sativa var. lobata (RD2). Each value represents the mean ± S.E. of three replicates. The letters above bars indicate significant differences according to Tukey's test (p < 0.05)
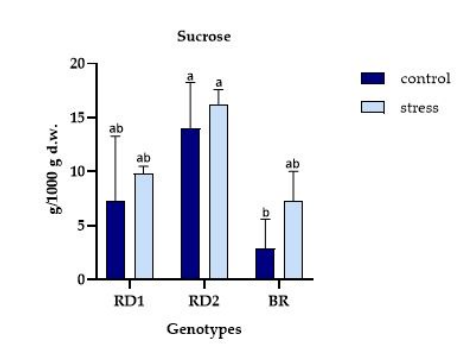
Figure 9: Variation of the sucrose (g/1000 g d.w.) in microgreens of Broccolo nero (BR), Eruca sativa var. darkita (RD1) and Eruca sativa var. lobata (RD2). Each value represents the mean ± S.E. of three replicates. The letters above bars indicate significant differences according to Tukey's test (p < 0.05)
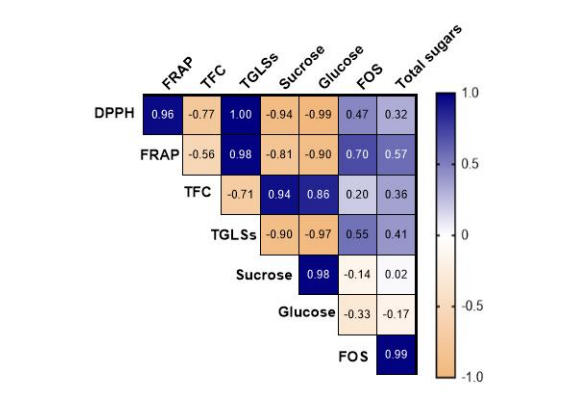
Figure 10: Pearson's correlation coefficients among the different variables studied for control condition
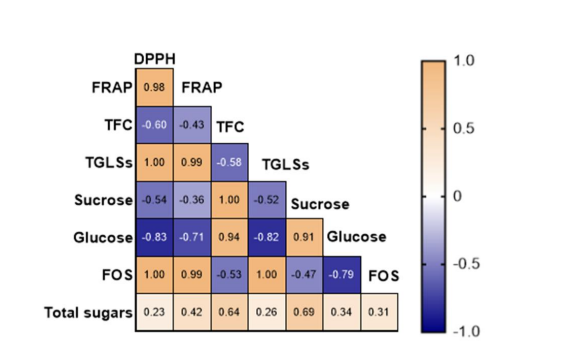
Figure 11: Pearson's correlation coefficients among the different variables studied for stress condition
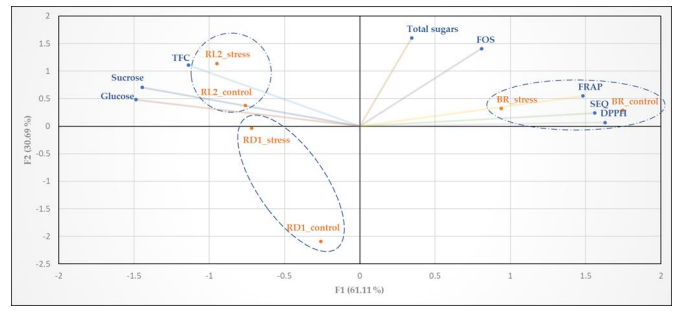
Figure 12: Principal component analysis biplot with control=SR100, stress= SR40, BR= Broccolo nero, RD1= Eruca sativa var. darkita and RD2= Eruca sativa var. lobata
Tables at a glance
Figures at a glance