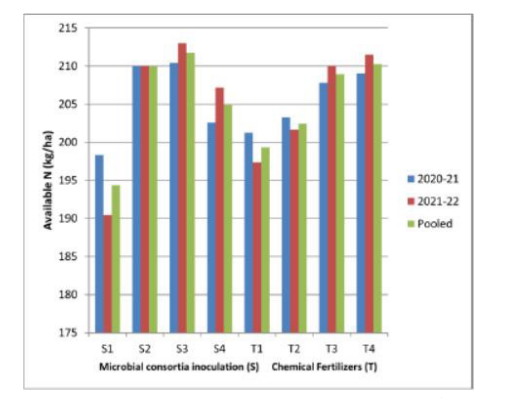
Figure 1: Effect of microbial consortia inoculation and chemical fertilizers on soil available nitrogen (kg ha-1) in Soybean and Chickpea
Treatment |
T1- Control (without fertilizer) |
T2- 50% RDF |
T3-75% RDF |
T4-100% RDF |
Mean |
S1-Uninoculated control |
5.07 |
5.14 |
5.16 |
5.23 |
5.15 |
S2- Bradyrhizobium+ Bacillus megateriuminoculation (Consortia-I) |
6.25 |
6.38 |
6.65 |
6.72 |
6.50 |
S3- Bradyrhizobium+ Pseudomonastriata |
6.97 |
7.15 |
7.42 |
7.57 |
7.28 |
S4- Bradyrhizobium + Thiobacillus thiooxidantinoculation (Consortia-III) |
6.35 |
6.42 |
6.50 |
6.63 |
6.48 |
Mean |
6.16 |
6.27 |
6.43 |
6.54 |
|
S.E. + 0.03 |
|||||
C.D. at 5% 0.11 |
|||||
Table 1: Interaction effect of microbial consortia inoculation and chemical fertilizers on organic carbon (g kg-1 soil) of soybean
Treatment |
T1- Control (without fertilizer) |
T2- 50% RDF |
T3-75% RDF |
T4-100% RDF |
Mean |
S1-Uninoculated control |
4.17 |
3.83 |
4.00 |
4.07 |
4.02 |
S2- Bradyrhizobium+ Bacillus megateriuminoculation (Consortia-I) |
5.60 |
6.43 |
6.63 |
6.60 |
6.32 |
S3- Bradyrhizobium+ Pseudomonastriata |
6.39 |
6.83 |
7.50 |
7.50 |
7.19 |
S4- Bradyrhizobium +Thiobacillus thiooxidantinoculation (Consortia- III) |
5.67 |
6.00 |
6.17 |
6.50 |
6.08 |
Mean |
5.59 |
5.78 |
6.08 |
6.17 |
|
S.E. + 0.17 |
|||||
C.D. at 5% 0.51 |
|||||
Table 2: Interaction effect of microbial consortia inoculation and chemical fertilizers on organic carbon (g kg-1 soil) of chickpea
Treatment |
T1- Control (without fertilizer) |
T2- 50% RDF |
T3-75% RDF |
T4-100% RDF |
Mean |
S1-Uninoculated control |
152.72 |
159.11 |
161.39 |
166.03 |
159.15 |
S2- Bradyrhizobium+ Bacillus megateriuminoculation (Consortia-I) |
170.77 |
174.30 |
179.25 |
185.l01 |
177.34 |
S3- Bradyrhizobium+ Pseudomonastriata |
216.93 |
226.71 |
233.38 |
236.41 |
228.35 |
S4- Bradyrhizobium + Thiobacillus thiooxidantinoculation (Consortia- III) |
168.29 |
172.04 |
173.58 |
177.82 |
172.93 |
Mean |
177.41 |
183.17 |
186.33 |
190.87 |
|
S.E. + 3.88 |
|||||
C.D. at 5% 11.22 |
|||||
Table 3 Interaction effect of microbial consortia inoculation and chemical fertilizers on available nitrogen (kg ha-1) in soil of soybean
Treatment |
T1- Control (without fertilizer) |
T2- 50% RDF |
T3-75% RDF |
T4-100% RDF |
Mean |
S1-Uninoculated control |
191.50 |
191.60 |
196.52 |
198.31 |
194.37 |
S2- Bradyrhizobium+ Bacillus megateriuminoculation (Consortia-I) |
202.26 |
207.10 |
214.16 |
216.14 |
210.03 |
S3- Bradyrhizobium+ Pseudomona striatainoculation (Consortia- II) |
203.88 |
206.67 |
218.34 |
217.93 |
211.;71 |
S4- Bradyrhizobium +Thiobacillus thiooxidantinoculation (Consortia- III) |
200.15 |
204.41 |
206.22 |
208.60 |
204.85 |
Mean |
199.34 |
202.45 |
208.92 |
210.25 |
|
S.E. + 1.31 |
|||||
C.D. at 5% 3.79 |
|||||
Table 4 Interaction effect of microbial consortia inoculation and chemical fertilizers on available nitrogen (kg ha-1) in soil of Chickpea
Treatment |
T1- Control (without fertilizer) |
T2- 50% RDF |
T3-75% RDF |
T4-100% RDF |
Mean |
S1-Uninoculated control |
15.95 |
16.09 |
16.56 |
16.62 |
16.30 |
S2- Bradyrhizobium+ Bacillus megateriuminoculation (Consortia-I) |
17.63 |
18.43 |
18.45 |
19.30 |
18.45 |
S3- Bradyrhizobium+ Pseudomonastriata |
19.24 |
`20.21 |
20.62 |
20.49 |
20.14 |
S4- Bradyrhizobium + Thiobacillus thiooxidantinoculation (Consortia-III) |
17.5;9 |
18.05 |
18.63 |
19.04 |
18.33 |
Mean |
17.61 |
18.20 |
18.56 |
18.86 |
|
S.E. + 0.16 |
|||||
C.D. at 5% 0.47 |
|||||
Table 5 Interaction effect of microbial consortia inoculation and chemical fertilizers on available phosphorus (kg ha-1) in soil of Soybean
Treatment |
T1- Control (without fertilizer) |
T2- 50% RDF |
T3-75% RDF |
T4-100% RDF |
Mean |
S1-Uninoculated control |
15.37 |
15.46 |
15.40 |
15.41 |
`15.41 |
S2- Bradyrhizobium+ Bacillus megateriuminoculation (Consortia-I) |
17.23 |
16.80 |
17.79 |
18.42 |
17.56 |
S3- Bradyrhizobium+ Pseudomonastriata |
18.44 |
18.64 |
19.02 |
19.08 |
18.80 |
S4- Bradyrhizobium + Thiobacillus thiooxidantinoculation (Consortia-III) |
17.16 |
17.35 |
17.70 |
17.54 |
17.44 |
Mean |
17.50 |
17.06 |
17.48 |
17.61 |
|
S.E. + 0.24 |
|||||
C.D. at 5% 0.71 |
|||||
Table 6 Interaction effect of microbial consortia inoculation and chemical fertilizers on available phosphorus (kg ha-1) in soil of Chickpea
Treatment |
T1- Control (without fertilizer) |
T2- 50% RDF |
T3-75% RDF |
T4-100% RDF |
Mean |
S1-Uninoculated control |
583.10 |
573.53 |
576.00 |
579.87 |
578.13 |
S2- Bradyrhizobium+ Bacillus megateriuminoculation (Consortia-I) |
607.67 |
655.70 |
648.67 |
678.73 |
647.69 |
S3- Bradyrhizobium+ Pseudomonastriata |
683.77 |
682.17 |
706.70 |
698.70 |
692.83 |
S4- Bradyrhizobium + Thiobacillus thiooxidantinoculation (Consortia-III) |
603.90 |
623.83 |
630.80 |
641.00 |
624.88 |
Mean |
619.61 |
633.81 |
640.54 |
649.58 |
|
S.E. + 8.63 |
|||||
C.D. at 5% 24.92 |
|||||
Table 7 Interaction effect of microbial consortia inoculation and chemical fertilizers on available potassium (kg ha-1) in soil of Soybean
Treatment |
T1- Control (without fertilizer) |
T2- 50% RDF |
T3-75% RDF |
T4-100% RDF |
Mean |
S1-Uninoculated control |
551.83 |
551.83 |
568.33 |
581.83 |
563.46 |
S2- Bradyrhizobium+ Bacillus megateriuminoculation (Consortia-I) |
643.33 |
638.93 |
648.00 |
650.43 |
645.18 |
S3- Bradyrhizobium+ Pseudomonastriata |
637.02 |
655.50 |
661.77 |
686.33 |
660.15 |
S4- Bradyrhizobium + Thiobacillus thiooxidantinoculation (Consortia-III) |
620.00 |
621.67 |
626.67 |
636.67 |
626.25 |
Mean |
613.05 |
616.98 |
626.19 |
638.82 |
|
S.E. + 4.36 |
|||||
C.D. at 5% 12.60 |
|||||
Table 8 Interaction effect of microbial consortia inoculation and chemical fertilizers on available potassium (kg ha-1) in soil of Chickpea
Figure 1: Effect of microbial consortia inoculation and chemical fertilizers on soil available nitrogen (kg ha-1) in Soybean and Chickpea
Tables at a glance
Figures at a glance