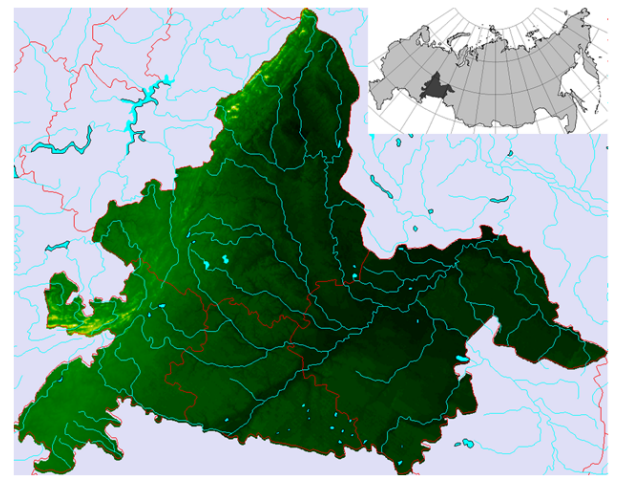
Figure 1: The region under study is located east of the Ural Mountains
Figure 1: The region under study is located east of the Ural Mountains
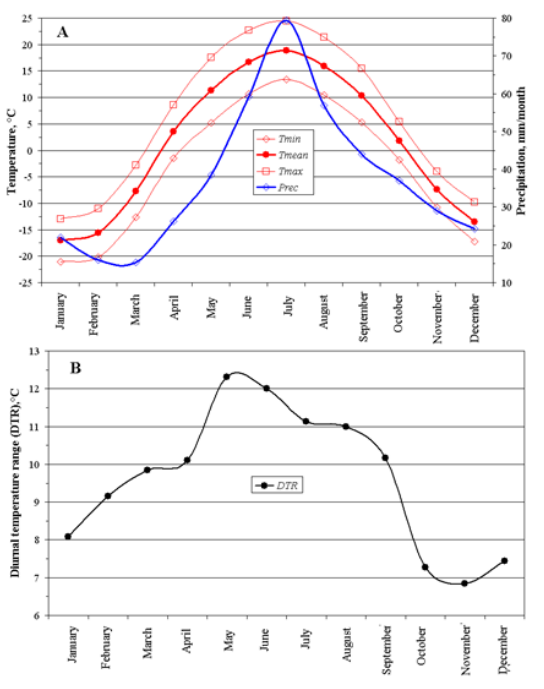
Figure 2: The dependence of regional average temperatures and precipitation (A) and diurnal temperature range DTR (B) on months.
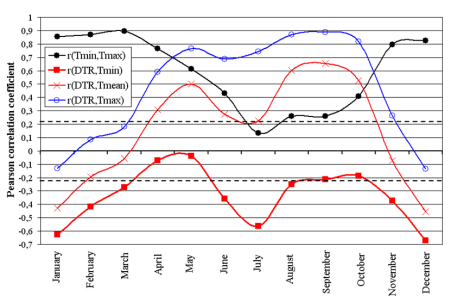
Figure 3: Correlation between temperatures and DTR as a function of month. The point between the dotted lines corresponds to a non-significant relationship at P < 0.05
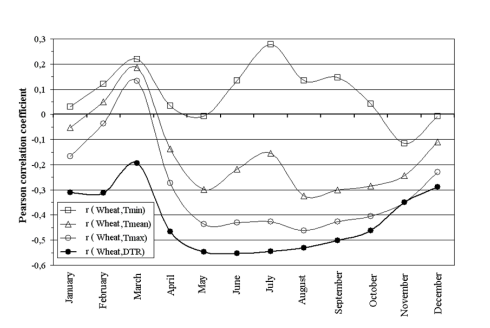
Figure 4: Dependence of the correlation coefficient between the yield of spring wheat and Tmin, Tmean, Tmax, DTR on months. The points located between the dotted lines correspond to a non-significant relationship at P < 0.05
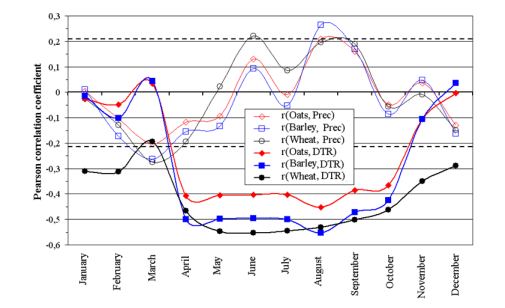
Figure 5: Dependence of correlation coefficient between the yield of wheat, barley and oats and DTR and precipitation Prec on months. Points lying between the dotted lines correspond to non-significant links at P < 0.05
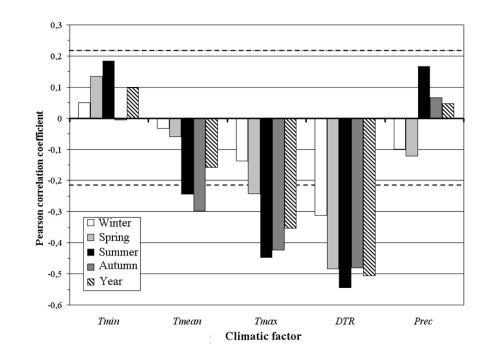
Figure 6: Dependence of the correlation coefficient between the yield of spring wheat and climatic factors on the time of year. The bars placed between the dotted lines correspond to a non-significant relationship at P < 0.05
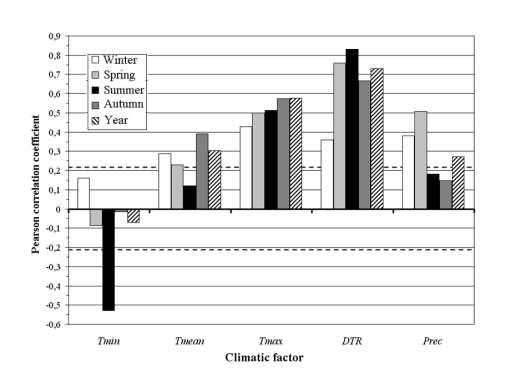
Figure 7: Relationship between climatic factors and altitude in the region. The bars located between the dotted lines correspond to a non-significant relationship at P < 0.05
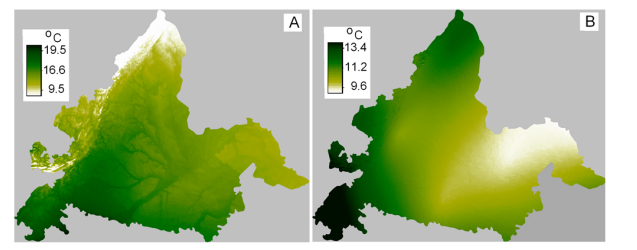
Figure 8: Maps of summer Tmean (A) and summer DTR (B).
Figures at a glance