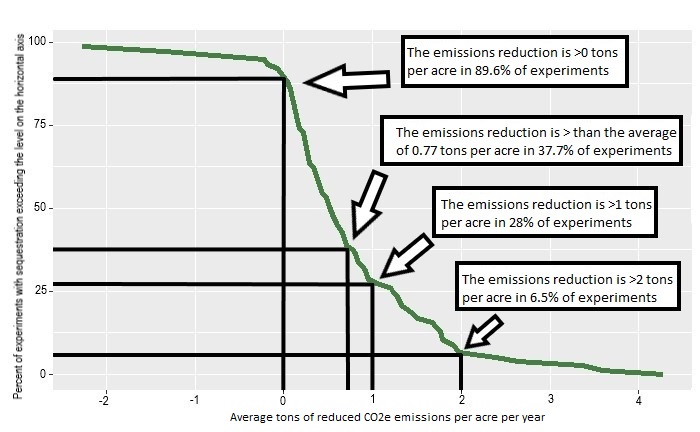
Figure 1: Frequency distribution of annual emissions reductions due to switching from standard tillage to no-till
Figure 1: Frequency distribution of annual emissions reductions due to switching from standard tillage to no-till
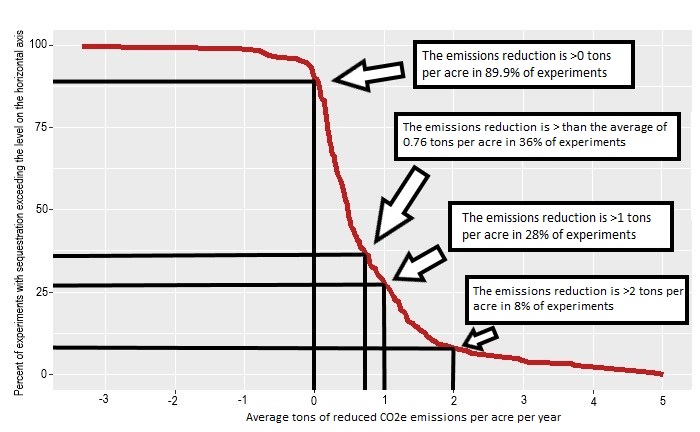
Figure 2: Frequency distribution of annual emissions reductions due to adding cover crops
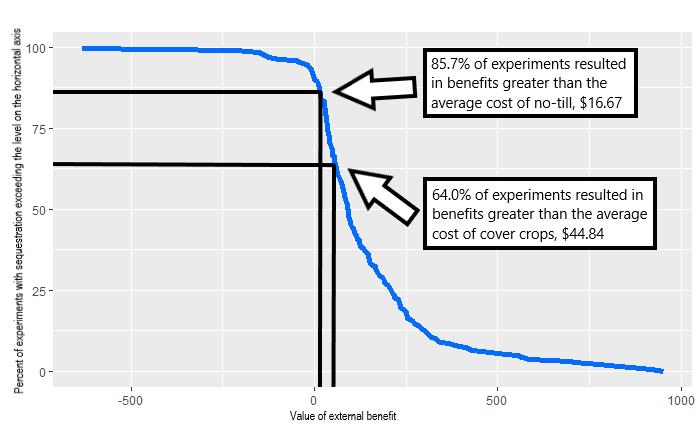
Figure 3: Frequency distribution of average per-acre social benefit from carbon sequestration by reducing tillage or by adopting cover crops
Figures at a glance