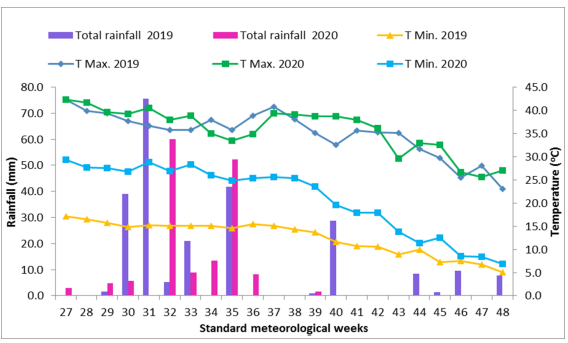
Figure 1: Mean Weekly Meteorological data recorded during kharif season of 2019 and 2020
Properties |
Value (mean ± S.D.) |
Method Used |
Sand (%) |
83.05±0.77 |
20 |
Silt (%) |
10.45±0.76 |
|
Clay (%) |
6.49±0.50 |
|
Textural class |
Loamy Sand |
21 |
-3 |
1.54±0.1 |
22 |
-1 |
0.40±0.08 |
23 |
pH (1:2 soil: water) |
8.5±0.16 |
23 |
-1 |
0.22±0.06 |
24 |
Organic carbon (OC) (%) |
0.11±0.02 |
25 |
-1 |
18.68±5 |
26 |
-1 |
120.4±9.5 |
27 |
-1 |
254.6±13 |
26 |
Table 1: Initial soil properties of surface layer (0-15 cm)
Sl.No. |
Abbreviation |
Treatments |
Tillage |
Crop establishment |
Water management |
Sheep manure |
Crop management |
Main-plot treatments (Tillage) |
|||||||
1. |
DT |
Deep Tillage |
1passes of disc harrow,1passes of harrow,1passes of rotavator, 1 passes of tiller, 1 pass of planking |
Multi crop planter |
Based on critical growth stages |
Broadcasted |
Standard practices followed |
2. |
ST |
Shallow tillage |
1passes of harrow, 1passes of rotavator, 1 passes of tiller, 1 pass of planking |
Multi crop planter |
Based on critical growth stages |
Broadcasted |
Standard practices followed |
3. |
MT |
Minimum tillage |
1 passes of |
Multi crop planter |
Based on critical growth stages |
Broadcasted |
Standard practices followed |
Sub-plot treatments ( Integrated Nutrient Management practices, NM) |
|||||||
1. |
F0 |
No fertilizer applied (control) |
|||||
2. |
F1 |
-1 |
|||||
3. |
F2 |
-1 |
|||||
4. |
F3 |
-1 |
|||||
5. |
F4 |
-1 -1 |
|||||
6. |
F5 |
-1 -1 |
|||||
Table 2: Detail of tillage, crop and nutrient management under different treatments of peanut cultivation
Particulars |
2019 |
2020 |
a -1 |
0.73 |
0.75 |
-1 |
0.04 |
0.04 |
|
3.04 |
3.04 |
|
0.08 |
0.08 |
|
0.34 |
0.34 |
|
0.26 |
0.26 |
|
1.71 |
1.71 |
|
5.71 |
5.71 |
|
13.71 |
13.71 |
Rotavator |
22.86 |
22.86 |
Disc plough |
22.86 |
22.86 |
Harrow |
17.14 |
17.14 |
INR/USD exchange rate |
70 |
70 |
Table 3: Effect of integrated nutrient management on leaf area index and chlorophyll content at different stages of sorghum
aUSD- United states dollar
Particulars |
Units |
Energy equivalents (MJ |
References |
Input |
|
|
|
Human labour |
Man-hour |
1.96 |
32 |
Diesel |
Liter |
56.31 |
32 |
Nitrogen (N) |
|
66.14 |
32 |
Phosphorus (P2 O5 ) |
|
12.44 |
32 |
Potassium (K2 O) |
Kg |
11.15 |
32 |
Herbicides, insecticides and pesticides |
Kg |
120.00 |
32 |
Manures |
Kg |
0.3 |
33 |
Irrigation water |
ha-cm |
143.56 |
32 |
Groundnut seed |
Kg |
25.00 |
34 |
Output |
|
|
|
Peanut pod yield |
Kg |
25.00 |
34 |
Peanut haulm yield |
Kg |
18.00 |
34 |
Table 4: Energy equivalents (MJ unit-1) used for calculating energy inputs and outputs
Treatments |
Tillage |
Nutrients |
Tillage x Nutrients |
Pod yield |
0.0028** |
<.0001** |
0.9148 |
Kernel yield |
0.0001** |
<.0001** |
<.0001** |
Oil yield |
0.0001** |
<.0001** |
0.0113* |
Protein yield |
0.0002** |
<.0001** |
<.0001** |
Water use efficiency |
0.0089** |
<.0001** |
0.9326 |
Net returns |
0.0033** |
<.0001** |
0.9064 |
Energy input |
<.0001** |
<.0001** |
0.7955 |
Energy output |
0.0078** |
<.0001** |
0.9045 |
Energy use efficiency |
0.0015** |
<.0001** |
0.8017 |
Energy productivity |
0.0026** |
<.0001** |
0.8251 |
Table 5: Analysis of variance (ANOVA) showing significance of the effects of main sub treatments and their interaction on pod and kernel yield (Mg ha-1), water use efficiency (kg ha-1 mm) and net returns (US$ ha-1), oil and protein yield of peanut, as re- sulted from analysis of variance (ANOVA)
** - Significant at 1%, * - Significant at 5%
Treatments |
F0 |
F1 |
F2 |
F3 |
F4 |
F5 |
Mean |
Pod yield (Mg ha )-1 |
|||||||
DT |
2.49 |
2.62 |
2.86 |
3.01 |
3.42 |
3.50 |
|
ST |
2.33 |
2.54 |
2.86 |
2.98 |
3.18 |
3.23 |
A |
MT |
1.99 |
2.29 |
2.67 |
2.78 |
3.02 |
3.08 |
|
Mean |
|
|
|
|
A |
|
|
Kernel yield (Mg ha )-1 |
|||||||
DT |
1.72 |
1.80 |
2.12 |
2.25 |
2.48 |
2.59 |
|
ST |
1.44 |
1.67 |
1.99 |
2.15 |
2.36 |
2.44 |
|
MT |
1.31 |
1.48 |
1.70 |
1.80 |
1.98 |
2.01 |
|
Mean |
|
|
|
|
|
|
|
Table 6: Effect of tillage and fertilizer nutrient management practices on pod and kernel yield (Mg ha-1) of peanut (2- year mean)
Treatments |
F0 |
F1 |
F2 |
F3 |
F4 |
F5 |
Mean |
Oil yield (Mg ha ) -1 |
|||||||
DT |
0.69 |
0.74 |
0.89 |
0.95 |
1.06 |
1.11 |
|
ST |
0.58 |
0.69 |
0.83 |
0.90 |
1.00 |
1.04 |
|
MT |
0.51 |
0.60 |
0.70 |
0.75 |
0.83 |
0.86 |
|
Mean |
|
|
|
|
|
|
|
Protein yield (Mg ha )-1 |
|||||||
DT |
0.18 |
0.20 |
0.24 |
0.25 |
0.28 |
0.29 |
|
ST |
0.15 |
0.18 |
0.22 |
0.24 |
0.27 |
0.28 |
|
MT |
0.14 |
0.16 |
0.19 |
0.20 |
0.22 |
0.23 |
|
Mean |
|
|
|
|
|
|
|
Table 7: Effect of tillage and fertilizer management practices on oil and protein yield (Mg ha-1) of peanut (2- year mean)
Treatments |
F0 |
F1 |
F2 |
F3 |
F4 |
F5 |
Mean |
water productivity (kg ha mm)-1 |
|||||||
DT |
5.88 |
6.25 |
6.81 |
7.18 |
8.21 |
8.27 |
|
ST |
5.55 |
6.17 |
6.88 |
7.15 |
7.60 |
7.68 |
A |
MT |
4.76 |
5.44 |
6.39 |
6.67 |
7.28 |
7.47 |
B |
Mean |
|
|
|
|
|
|
General Mean=6.76 |
Net returns (USD ha ) -1 |
|||||||
DT |
1901.09 |
2005.55 |
2201.55 |
2328.70 |
2647.43 |
2708.32 |
|
ST |
1781.98 |
1947.50 |
2198.31 |
2294.51 |
2454.62 |
2493.15 |
|
MT |
1514.03 |
1748.31 |
2051.49 |
2141.72 |
2337.57 |
2384.92 |
|
Mean |
|
|
|
|
|
|
|
Table 8: Effect of tillage and fertilizer management practices on water productivity (kg ha-1 mm) and net returns (USD ha-1) of peanut (2-year mean)
Treatments |
F0 |
F1 |
F2 |
F3 |
F4 |
F5 |
Mean |
Energy input |
|||||||
DT |
15.78 |
17.09 |
17.45 |
17.75 |
17.99 |
18.23 |
|
ST |
14.51 |
15.82 |
16.18 |
16.48 |
16.72 |
16.96 |
|
MT |
13.29 |
14.60 |
14.97 |
15.27 |
15.51 |
15.75 |
|
Mean |
|
|
|
|
|
|
|
Energy output |
|||||||
DT |
138.22 |
143.97 |
157.91 |
166.84 |
182.30 |
184.73 |
|
ST |
134.03 |
143.69 |
156.32 |
161.61 |
171.51 |
173.75 |
|
MT |
119.86 |
130.65 |
148.47 |
152.76 |
167.47 |
170.05 |
|
Mean |
|
|
|
|
|
|
|
Energy use efficiency |
|||||||
DT |
8.50 |
8.41 |
8.96 |
9.10 |
9.53 |
9.53 |
|
ST |
9.53 |
9.10 |
9.76 |
10.12 |
10.90 |
10.89 |
|
MT |
9.02 |
8.95 |
9.92 |
10.01 |
10.80 |
10.80 |
|
Mean |
|
|
|
|
|
|
|
Energy productivity |
|||||||
DT |
0.15 |
0.15 |
0.16 |
0.17 |
0.18 |
0.18 |
|
ST |
0.17 |
0.17 |
0.18 |
0.18 |
0.20 |
0.21 |
|
MT |
0.15 |
0.16 |
0.18 |
0.18 |
0.20 |
0.20 |
|
Mean |
|
|
|
|
|
|
|
Table 9: Effect of tillage and fertilizer management practices on energy input (×103 MJ ha-1), output (×103 MJ ha-1), energy ef- ficiency (MJ ha-1) and energy productivity (kg MJ-1) of peanut (2-year mean)
Figure 1: Mean Weekly Meteorological data recorded during kharif season of 2019 and 2020
Tables at a glance
Figures at a glance