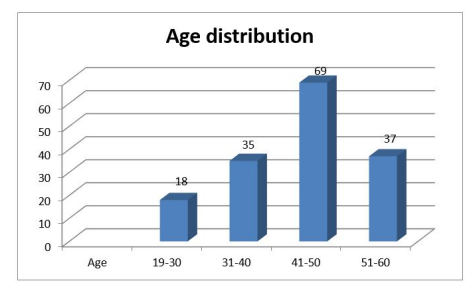
Figure 1: Age distribution of participants (N=159)
Figure 1: Age distribution of participants (N=159)
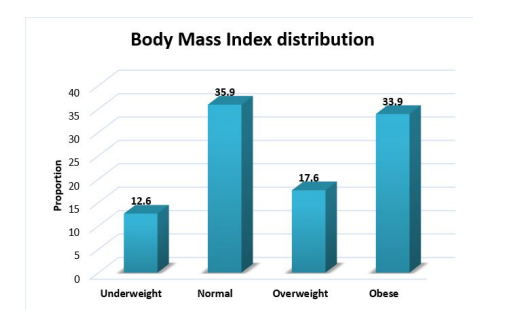
Figure 2: Body Mass Index distribution of participants (N=159)
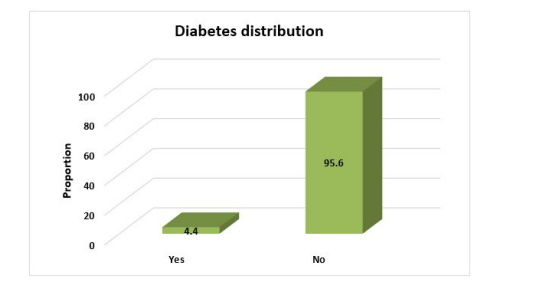
Figure 3: Diabetes distribution among participants (N=159)
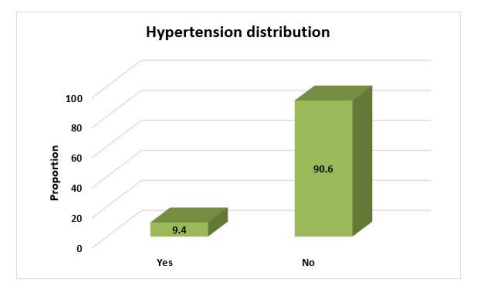
Figure 4: Hypertension distribution among participants (N=159)
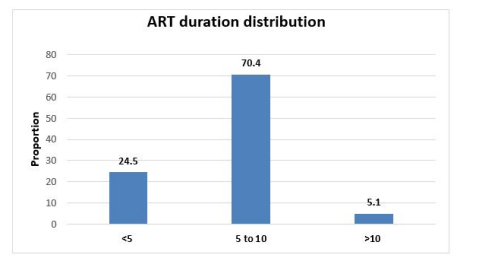
Figure 5: ART duration distribution
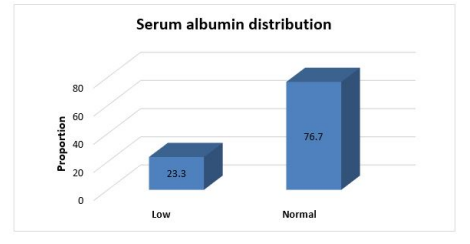
Figure 6: Serum albumin distribution among participants (N=159)
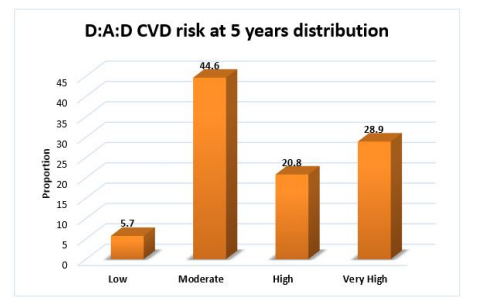
Figure 7: D:A:D CVD risk at 5 years distribution among participants (N=159)
Tables at a glance
Figures at a glance