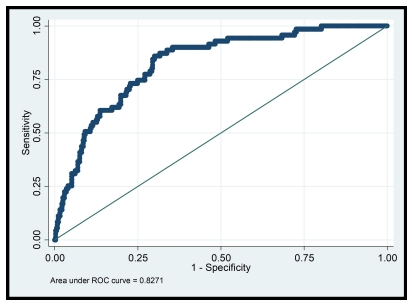
Figure 1: Receiver operating characteristics for "calibration" of multivariable logistic regression model of factors associated with impaired kidney function
Characteristics |
Frequency |
Proportion (%) |
|
Age, mean (± SD), years (N=444) |
46.3 ± 9.4 |
|
|
Gender |
|
N=444 |
|
|
Male |
135 |
30.4 |
|
Female |
309 |
69.6 |
Educational level |
|
N=444 |
|
|
Tertiary |
81 |
18.2 |
Secondary/Senior high school |
155 |
34.9 |
|
|
Junior high school |
174 |
39.2 |
|
None |
34 |
7.7 |
Religion |
|
N=444 |
|
|
Christianity |
393 |
88.5 |
|
Moslem |
46 |
10.4 |
|
Atheist |
5 |
1.1 |
Marital status |
|
N=444 |
|
|
Married |
222 |
50.0 |
|
Single |
151 |
34.0 |
|
Divorced |
48 |
10.8 |
|
Widowed |
23 |
5.2 |
Smoking of cigarettes |
|
N=444 |
|
|
Non-smoker |
401 |
90.3 |
|
Previous smoker |
34 |
7.7 |
|
Current smoker |
9 |
2.0 |
Drinking of alcohol |
|
N=444 |
|
|
Non-drinker |
263 |
59.2 |
|
Previous drinker |
93 |
21.0 |
|
Current drinker |
88 |
19.8 |
Employment status |
|
N=444 |
|
|
Self-employed |
374 |
84.2 |
Government/Privately employed |
34 |
7.7 |
|
Unemployed |
36 |
8.1 |
|
Table 1: Socio-demographic characteristics of study participants
SD=Standard deviation
Characteristics |
Frequency |
Proportion (%) |
|
Duration of HIV diagnosis, median [IQR], years (N=444) |
6.0 [3.8-9.0] |
|
|
TDF-based ART duration, median [IQR], years (N=444) |
2.0 [1.0-4.0] |
|
|
BMI category |
|
N=444 |
|
|
Under weight |
9 |
2 |
|
Normal weight |
186 |
41.9 |
|
Overweight/Obese |
249 |
56.1 |
CD4+ T cell Count |
N=444 |
|
|
<200 cells/µL |
75 |
16.9 |
|
≥200 cells/µL |
369 |
83.1 |
|
Hypertension |
|
N=444 |
|
|
Present |
110 |
24.8 |
|
Absent |
334 |
75.2 |
Dyslipidaemia |
|
N=444 |
|
|
Present |
18 |
4.1 |
|
Absent |
426 |
95.9 |
Hepatitis B |
|
N=444 |
|
|
Present |
8 |
1.8 |
|
Absent |
436 |
98.2 |
Impaired kidney function |
|
N=444 |
|
|
Present |
71 |
16 |
|
Absent |
373 |
84 |
Impaired kidney function classification |
N=444 |
|
|
Normal kidney function |
188 |
42.3 |
|
Mildly impaired kidney function |
185 |
41.7 |
|
Moderately impaired kidney function |
68 |
15.3 |
|
Severely impaired kidney function |
3 |
0.7 |
|
Kidney failure |
- |
- |
|
Table 2: Clinical characteristics of study participants
IQR=interquartile range; BMI=Body mass index; TDF=Tenofovir disoproxil fumarate; ART=Antiretroviral therapy
Characteristics |
Impaired kidney function |
CrudeOdds ratio [95% CI] |
p-value |
||
Present |
Absent |
||||
n, %1 |
n, %1 |
||||
Age, median (± SD), years |
49.1 ± 8.1 |
45.8 ± 9.6 |
1.04 [1.02-1.07] |
0.009 |
|
Gender |
|
|
|
|
|
|
Female |
22 (7.1) |
287 (92.9) |
1.00 |
|
|
Male |
49 (36.3) |
86 (63.7) |
7.43 [4.26-12.98] |
<0.001 |
Educational level |
|
|
|
|
|
|
Tertiary |
11 (32.3) |
23 (67.7) |
1.00 |
|
Secondary/Senior high school |
28 (16.1) |
146 (83.9) |
0.40 [0.18-0.91] |
0.030 |
|
Junior high school |
21 (13.5) |
134 (86.5) |
0.33 [0.14-0.77] |
0.010 |
|
|
None |
11 (13.6) |
70 (86.4) |
0.33 [0.13-0.86] |
0.023 |
Religion |
|
|
|
|
|
|
Christianity |
57 (14.5) |
336 (85.5) |
1.00 |
|
|
Moslem |
13 (28.3) |
33 (71.7) |
2.32 [1.15-4.68] |
0.018 |
|
Atheist |
1 (20.0) |
4 (80.0) |
1.48 [0.16-13.42] |
0.731 |
Marital status |
|
|
|
|
|
|
Single |
18 (11.9) |
133 (88.1) |
1.00 |
|
|
Married |
45 (20.3) |
177 (79.7) |
1.87 [1.04-3.39] |
0.037 |
|
Divorced |
6 (12.5) |
42 (87.5) |
1.06 [0.39-2.83] |
0.914 |
|
Widowed |
2 (8.7) |
21 (91.3) |
0.70 [0.15-3.26] |
0.653 |
Smoking of cigarettes |
|
|
|
|
|
|
Non-smoker |
57 (14.2) |
344 (85.8) |
1.00 |
|
Previous smoker |
10 (29.4) |
24 (70.6) |
2.51 [1.14-5.54] |
0.022 |
|
Current smoker |
4 (44.4) |
5 (55.6) |
4.83 [1.26-18.52] |
0.022 |
|
Drinking of alcohol |
|
|
|
|
|
|
Non-drinker |
30 (11.4) |
233 (88.6) |
1.00 |
|
Previous drinker |
20 (21.5) |
73 (78.5) |
2.13 [1.04-3.97] |
0.018 |
|
Current drinker |
21 (23.9) |
67 (76.1) |
2.43 [1.31-4.53] |
0.005 |
|
Employment status |
|
|
|
|
|
Self-employed |
58 (15.5) |
316 (84.5) |
1.00 |
|
|
Government/Privately employed |
7 (20.6) |
27 (79.4) |
1.41 [0.59-3.40] |
0.440 |
|
|
Unemployed |
6 (16.7) |
30 (83.3) |
1.09 [0.43-2.73] |
0.855 |
Table 3: Bivariable logistic regression of socio-demographic characteristics associated with impaired kidney function among study partici- pants
Row percentage; CI=Confidence interval; SD=Standard deviation
Characteristics |
Impaired kidney function |
Crude odds ratio[95% CI] |
p-value |
||
Present |
Absent |
||||
n, %1 |
n, %1 |
||||
Duration since diagnosed with HIV, median [IQR], years |
6.0 [4.0-10.0] |
6.0 [3.6-9.0] |
1.05 [0.98-1.12] |
0.168 |
|
Duration since on TDF-based ART, median [IQR], years |
3.0 [2.0-4.0] |
1.4 [1.0-3.9] |
1.15 [1.03-1.29] |
0.012 |
|
BMI category |
|
|
|
|
|
|
Normal weight |
33 (17.7) |
153 (82.3) |
1.00 |
|
|
Under weight |
0 (0) |
9 (100) |
NE |
0.362* |
Overweight/Obese |
38 {15.3) |
211 (84.7) |
0.83 [0.50-1.39] |
0.489 |
|
CD4+ T cell count category |
|
|
|
|
|
|
≥200 cells/µL |
58 (15.7) |
311 (84.3) |
1.00 |
|
|
<200 cells/µL |
13 (17.3) |
62 (82.7) |
1.12 [0.58-2.18] |
0.728 |
Hypertension |
|
|
|
|
|
|
Absent |
39 (11.7) |
295 (88.3) |
1.00 |
|
|
Present |
32 (29.1) |
78 (70.9) |
3.10 [1.83-5.27] |
<0.001 |
Hepatitis B |
|
|
|
|
|
|
Absent |
70 (16.1) |
366 (83.9) |
1.00 |
|
|
Present |
1 (12.5) |
7 (87.5) |
0.75 [0.09-6.17] |
0.786 |
Dyslipidaemia |
|
|
|
|
|
|
Absent |
67 (15.7) |
359 (84.3) |
1.00 |
|
|
Present |
4 (22.2) |
14 (77.8) |
1.53 [0.49-4.79] |
0.465 |
Table 4: Bivariable logistic regression of clinical and HIV-related characteristics associated with impaired kidney function among study participants
Fisher's 2-sided exact test; 1 Row percentage; IQR=interquartile range; CI=Confidence interval; BMI=Body mass index; TDF=Tenofovir disoproxil fumarate; ART=Antiretroviral therapy
Characteristics |
Adjusted odds ratio [95% CI] |
p-value |
|
Age |
1.03 [1.01-1.08] |
0.012 |
|
Duration since diagnosed with HIV, median [IQR], years |
1.00 [0.99-1.00] |
0.566 |
|
Duration since on TDF-based ART, median [IQR], years |
1.18 [1.03-1.35] |
0.019 |
|
Gender |
|
|
|
Female |
1.00 |
|
|
Male |
8.19 [4.28-15.66] |
<0.001 |
|
Smoking of cigarettes |
|
|
|
|
Non-smoker |
1.00 |
|
|
Previous smoker |
0.80 [0.31-2.09] |
0.654 |
|
Current smoker |
2.08 [0.43-10.00] |
0.362 |
Drinking of alcohol |
|
|
|
|
Non-drinker |
1.00 |
|
|
Previous drinker |
1.05 [0.49-2.25] |
0.897 |
|
Current drinker |
1.50 [0.70-3.19] |
0.296 |
CD4+ T cell count category |
|
|
|
|
≥200 cells/µL |
1.00 |
|
|
<200 cells/µL |
0.91 [0.41-1.96] |
0.809 |
Hypertension |
|
|
|
|
Absent |
1.00 |
|
|
Present |
3.89 [2.03-7.45] |
<0.001 |
Table 5: Multiple logistic regression of socio-demographic, clinical and HIV-related characteristics associated with impaired kidney function among study participants
ART=Antiretroviral therapy; CI=Confidence interval; TDF=Tenofovir disoproxil fumarate
Figure 1: Receiver operating characteristics for "calibration" of multivariable logistic regression model of factors associated with impaired kidney function
Tables at a glance
Figures at a glance