
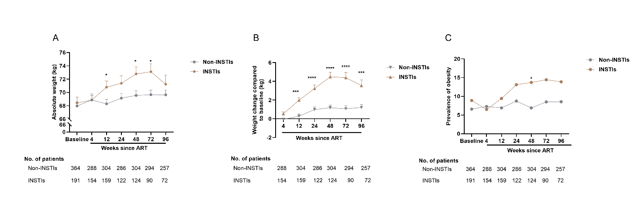
Figure 1: Body weight changes and the prevalence of obesity after ART between INSTIs group and non-INSTIs group. A, absolute body weight change; B, body weight change compared to baseline; C, the prevalence of obesity. *, p<0.05; ***, p<0.001; ****, p<0.0001

Tables at a glance
Figures at a glance