Table 1.1: First baseline treatment Summary Statistics of parameter theta.
Table 3
parameter
mean
sd
Mc error
2.50%
median
97.50%
start
sample
HR. beta1
0.865
0.1423
0.005481
0.6246
0.852
1.177
10001
50000
HR. beta2
0.742
0.2176
0.01459
0.4289
0.709
1.251
10001
40000
HR. beta3
0.716
0.1308
0.002404
0.4923
0.705
0.996
10001
30000
HR. beta4
0.997
0.0092
6.81E-04
0.9802
0.997
1.017
10001
30000
HR. beta5
1.003
0.0104
9.68E-04
0.9842
1.004
1.025
10001
30000
beta [1]
-0.156
0.162
0.005479
-0.4686
-0.157
0.162
10001
60000
beta [2]
-0.31
0.2839
0.01698
-0.8275
-0.319
0.276
10001
60000
beta [3]
-0.351
0.1776
0.00235
-0.7043
-0.349
-0.008
10001
60000
beta [4]
-0.004
-0.004
4.68E-04
-0.021
-0.004
0.013
10001
60000
beta [5]
0.004
0.0097
4.96E-04
-0.0138
0.004
0.024
10001
60000
Table 1.3: Bayesian Analysis Comparing Times to failure for combination 1 versus combination 2 (the Cox Model with Covariates).
Key: Where 1 = regimen, 2 = CD 4 count, 3 = gender, 4 = weight and 5 = age
Table 1.3 is read as; Hazard ratio (HR) from a survival analysis as a “reduction in the risk of treatment failure,” by an amount equal to 100 × (1 − HR) %. Stating, for instance, that “combination 2 reduces the risk of treatment failure by 13.5%, ” based on an observed survival HR beta 1 of regimen as 0.865, is a typical way of communicating survival benefit compared to combination 1, with standard deviation of 0.1423, MC error of 0.005481, credible interval of [0.6246,1.177[ , median of 0.852 and sampled up to 50000. These values are associated with the beta value of -0.156 for regimen as shown in the key below the table. The others are patients’ covariates such as: HR beta 2 for CD4 count, HR beta 3 for gender, HR beta 4 for weight and HR beta5 for age. It can be observed that age has HR beta of 0.997 which is 100% means there is no difference in survival due to age.
Table 4
Parameter
Chi-Square
df
Sig.
Log Rank (Mantel-Cox)
2.788
2
0.248
Breslow (Generalized Wilcoxon)
4.16
2
0.125
Tarone-Ware
3.572
2
0.168
Table 2.1: Overall Comparisons.
Table 5
Parameter
SE
df
Sig.
Exp()
95.0% CI for Exp()
Lower
Upper
Age
-.003
.008
1
.669
.997
.981
1.012
Gender
.185
.138
1
.180
1.204
.918
1.577
Drug1
2
.124
Drug1(1)
.040
.163
1
.804
1.041
.756
1.434
Drug1(2)
-.283
.170
1
.097
.754
.540
1.052
CD40 count
-.001
.000
1
.048
.999
.998
1.000
Wt.
.000
.000
1
.011
1.000
1.000
1.000
Table 2.2: Variables in the Equation
Tables at a glance
Table 1Table 2Table 3Table 4Table 5
Figures at a glance
Figure 1Figure 2Figure 3Figure 4Figure 5
FIGURE 1
FIGURE 2
FIGURE 3
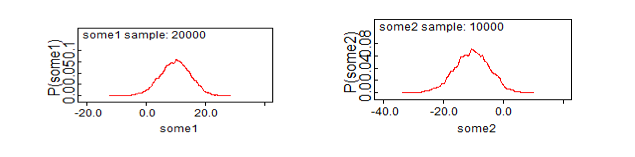
Figure1.3: Posterior density of some 1 and some 2
FIGURE 4
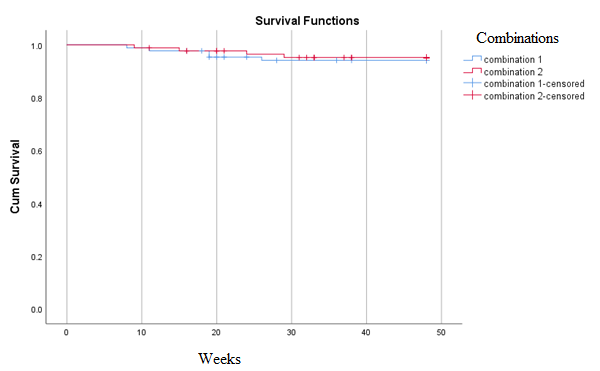
Figure 2.1: Comparison of Survival rate between combinations 1 and 2

Tables at a glance
Figures at a glance