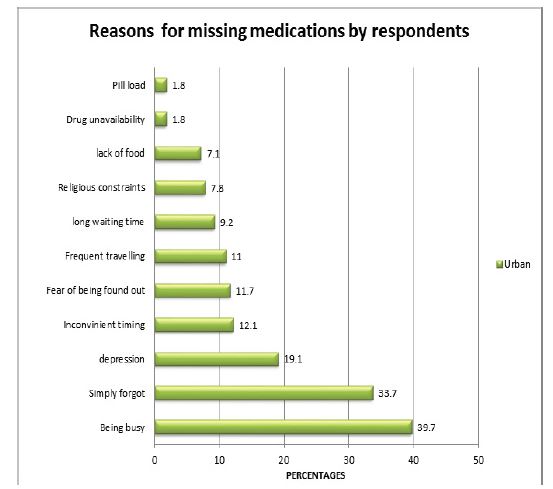
Figure 1: Reasons for missing medications by respondents
| Characteristics | Frequency N=282 | Percentage |
| Age (years) | ||
| <25 | 28 | 9.9 |
| 25-34 | 137 | 48.6 |
| 35-44 | 86 | 30.5 |
| 45-54 | 22 | 7.8 |
| >55 | 9 | 3.2 |
| Mean ±SD | 33.6 ±8.5 | |
| Marital Status | ||
| Single | 84 | 29.8 |
| Married | 138 | 48.9 |
| Divorced /separated | 26 | 9.2 |
| Widowed | 34 | 12.1 |
| Level of education | ||
| None | 14 | 5 |
| Primary | 49 | 17.4 |
| Secondary | 112 | 39.7 |
| Tertiary | 107 | 39.7 |
| Employment status | ||
| Employe.d | 214 | 75.9 |
| Unemployed | 68 | 24.1 |
| Average Monthly income | ||
| 2' N 19,000 ($1 l8.75) | 217 | 77 |
| > N 19,000 ($1 l 8.75) | 65 | 23 |
Table 1 : The Socio-demographic characteristics of study participants (n=282)
| Variable | Frequency (N=282) |
Percentage |
| Number of children | ||
| None | 83 | 29.4 |
| 44929 | 150 | 53.2 |
| 45022 | 38 | 13.5 |
| >6 | 11 | 3.9 |
| Spousal status | ||
| Positive | 52 | 18.4 |
| Negative | 230 | 81.6 |
| Household size | ||
| ≤5 | 214 | 75.9 |
| >5 | 68 | 24.1 |
| Living arrangement | ||
| Alone | 42 | 14.9 |
| With others | 240 | 85.1 |
| Disdosed HIV status | ||
| Yes | 261 | 92.6 |
| No | 21 | 7.4 |
| Perceived social support | ||
| Present | 198 | 70.2 |
| Absent | 84 | 29.8 |
| Belongs to a Support group | ||
| Yes | 48 | 17 |
| No | 234 | 83 |
Table 2: Family characteristics of study participants including support (n=282)
| Variable | Frequency N=282 | Percentage |
| Treatment duration (months) | ||
| <24 | 135 | 47.9 |
| ≥ 24 | 147 | 52. 1 |
| Median duration on Treat - ment | 24(IQR 24 - 44.8) | |
| Number of pills per day | ||
| ≤2 | 195 | 69.1 |
| >2 | 87 | 30.9 |
| Side effects | ||
| Yes | 129 | 45.7 |
| No | 153 | 54.3 |
| Herbal remedies | ||
| Yes | 93 | 33 |
| No | 189 | 67 |
| Perceived health status Rat- i11g | ||
| Good | 265 | 94 |
| Fair/poor | 17 | 6 |
| Paid for A RT services | ||
| Yes | 26 | 9.2 |
| No | 256 | 90.8 |
| Transportation cost to Health facility | ||
| < N 1000($ 6.25) | 204 | 72.3 |
| ≥ N 1000($ 6.25) | 78 | 27.7 |
Table 3: Medication/treatment variables including treatment experiences(n=282)
| Characteristics | Good Adherence (N=168) Frequency (%) |
Poor Adherence (N= 114) Frequency (%) |
Significance |
| Age (years) | |||
| 35 | 98(59.4) | 67(40.6) | p= 0.94 |
| >35 | 70(59.8) | 47(40.2) | x'= 0.01 |
| Marital status | |||
| Married | 85(59.0) | 59(41.0) | p= 0.85 |
| Not married | 83(60.1) | 55(39.9) | x'- o.o4 |
| Level of Education | |||
| < Secondary | 34(54.0) | 29(46.0) | p=0.30 |
| ≥Secondary | 134(61.2) | 85(38.8) | χ2= 1.06 |
| Children Number | |||
| ≤ 5 | 162(61.1) | 103(38.9) | p=0.04 |
| >5 | 6(35.3) | 11(64.7) | χ2= 4.43 |
| Spousal status | |||
| Positive | 34(65.4) | 18(34.6) | p=0.34 |
| Negative | 134(58.3) | 96(41.7) | χ2= 1.35 |
| Household size | |||
| ≤ 5 | 130(60.7) | 84(39.3) | p=0.48 |
| >5 | 38(55.9) | 30(44.1) | χ2= 0.51 |
| Living arrangement | |||
| Alone | 15(35.7) | 27(64.3) | p= 0.50 |
| With others | 99(41.3) | 141(58.8) | χ2=0.46 |
| Occupation | |||
| Employed | 85(39.7) | 129(60.3) | p= 0.67 |
| Not employed | 29(42.6) | 39(57.4) | χ2=0.18 |
| Average monthly income | |||
| ≤ N19,000 | 129(59.4) | 88(40.6) | p=0.94 |
| >N19,000 | 39(60.0) | 26(40.0) | χ2=0.01 |
| Perceived social support | |||
| Yes | 124(62.6) | 74(37.4) | p=0.11 |
| No | 44(52.4) | 40(47.6) | χ2=2.57 |
| Disclosed status | |||
| Yes | 103(39.5) | 158(60.5) | p=0.25 |
| No | 11(52.4) | 10(47.6) | χ2=1.35 |
Table 4: Distribution of socio-demographic characteristics of the study participants by their ART adherence pattern
| Characteristics | Good Adherence (N= 168) Frequency (%) |
Poor Adherence (N= 114) Frequency (%) |
Significance |
| Treatment duration | |||
| < 24 | 78(57.8) | 57(42.2) | p= 0.85 |
| ≥ 24 | 90(61.2) | 57(38.8) | χ2= 0.04 |
| Number of pills/day | |||
| ≤ 2 | 112(57.4) | 83(42.6) | p=0.27 |
| >2 | 56(64.4) | 31(35.6) | χ2= 1.20 |
| Side effects | |||
| No | 85(65.9) | 44(34.11) | p=0.04 |
| Yes | 83(54.2) | 70(45.8) | χ2= 3.94 |
| Used Herbal remedies | |||
| No | 119(63.0) | 70(37.0) | p=0.98 |
| Yes | 49(52.7) | 44(47.3) | χ2= 2.73 |
| Paid for ART services | |||
| No | 158(61.7) | 98(38.3) | p= 0.02 |
| Yes | 10(38.5) | 16(61.5) | χ2=5.30 |
| Transport cost | |||
| < N1000 | 114(55.9) | 90(44.1) | p=0.04 |
| ≥N1000 | 54(69.2) | 24(30.8) | χ2=4.18 |
| Perceived Health status | |||
| Fair/ poor 6(35.3) | 11(64.7) | p=0.03 | |
| Good | 162(61.1) | 103(38.9) | χ2=4.45 |
| Belongs to HIV support group | |||
| Yes | 27(56.3) | 21(43.8) | p=0.61 |
| No | 141(60.3) | 93(39.7) | χ2 = 0.27 |
Table 5: Distribution of Medical profile/ treatment experiences of the study participants by their ART adherence pattern (n=282)
| Independent Variable | Odds ratio | 95% confidence interval | p- value |
| Nwnber of children | |||
| ≤ 5 | 2.22 | 1.2 1- 4.09 | 0.01 |
| > 5 | 1 | ||
| Paid for ART services | |||
| No | 2.3 | 1.02- 5.10 | 0.04 |
| Yes | 1 | ||
| Pill number | |||
| >2 pills/day | 0.62 | 0.41-0.94 | 0.02 |
| ≤ 2pills /day | 1 | ||
| Description of perceived health status | |||
| Good | 2.45 | 1.90-5.03 | 0.015 |
| Fai r/poor | 1 | ||
| Encou ntered side effects | |||
| Yes | 0.77 | 0.55- 1.08 | 0.13 |
| No | 1 | ||
| Transportation costs | |||
| ≥ N 1000 ($ 6.25) | 2 | l.16-2.72 | 0.008 |
| <N 1000($ 6.25) | 1 |
Table 6: Binary logistic regression analysis of predictors for good adherence
Figure 1: Reasons for missing medications by respondents
Tables at a glance
Figures at a glance