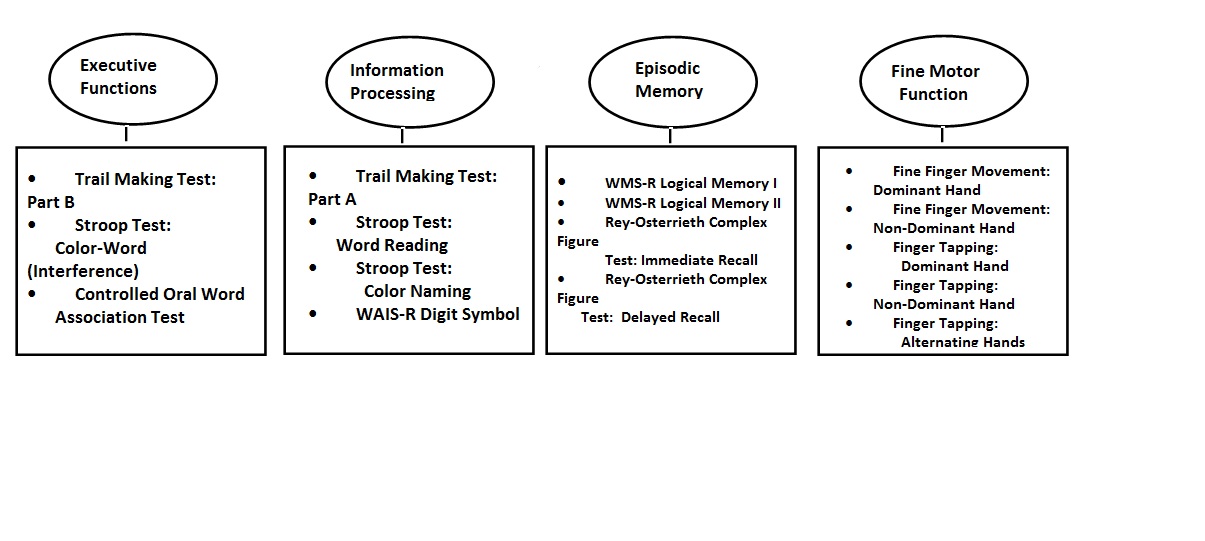
Figure 1 Four cognitive and motor domains examined (ovals) and the neuropsychological tests (squares) comprising each domain
Figure 1 Four cognitive and motor domains examined (ovals) and the neuropsychological tests (squares) comprising each domain
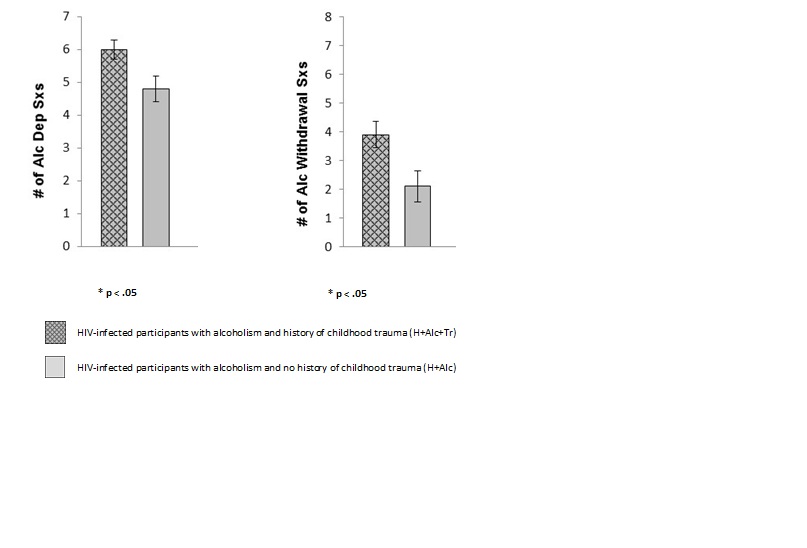
Figure 2 Mean number of alcohol dependence and alcohol withdrawal symptoms in HIV-infected alcoholic participants with and without history of childhood trauma
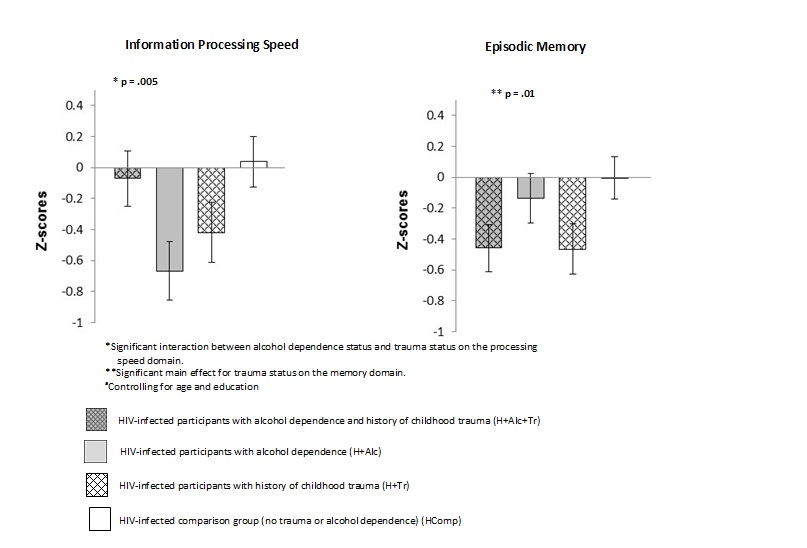
Figure 3 Z-score means and standard errors from significant ANCOVA analysesa testing the interaction of alcohol dependence and childhood trauma history in HIV infection on cognitive domains
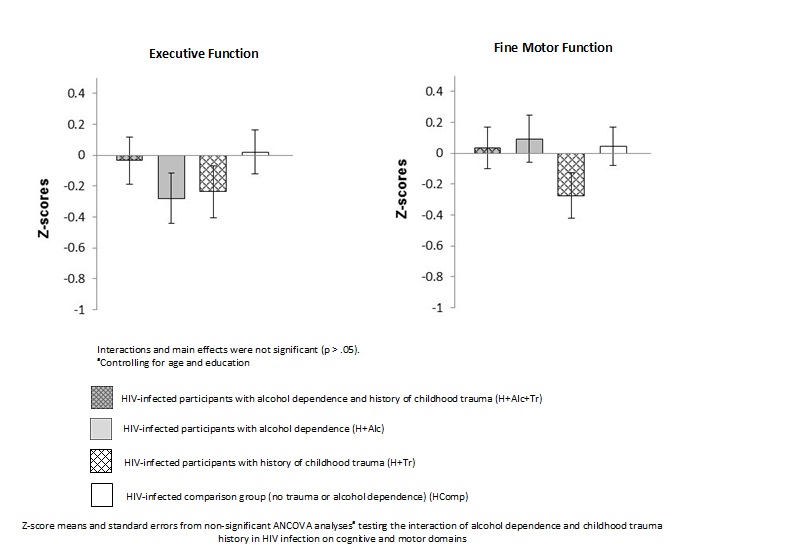
Figure 4 Z-score means and standard errors from non-significant ANCOVA analysesa testing the interaction of alcohol dependence and childhood trauma history in HIV infection on cognitive and motor domains
Types of Childhood Trauma Endorsed |
H+Alc+Tr |
H+Tr |
Lost home in natural disaster |
0 |
1 |
Life threatening accident, injury, illness |
1 |
2 |
Forced sexual intercourse |
9 |
4 |
Forced sexual touching |
7 |
6 |
Physical abuse by parent/guardian |
3 |
9 |
Physical abuse by boyfriend/girlfriend |
2 |
1 |
Physical abuse by someone else |
5 |
1 |
Physically assaulted or mugged |
4 |
3 |
Emotional abuse by parent/guardian |
6 |
9 |
Threatened with weapon/shot at (no injury) |
2 |
0 |
Injured with weapon or shot at |
0 |
0 |
Chased by someone where thought could get hurt |
7 |
1 |
Car crash where someone was killed/badly injured |
1 |
0 |
Table1 Number of subjects reporting types of childhood life traumas in either trauma group
Demographic Variables |
H+Alc+Tr % or Mean± |
H+Alc % or Mean±SD |
H+Tr % or Mean±SD |
HComp |
p value |
n = |
21 |
19 |
19 |
25 |
|
BACKGROUND DEMOGRAPHICS |
|
|
|
|
|
Sex (% Men) |
42.9% |
78.9% |
73.7% |
60.0% |
n.s. |
Ethnicity(% Non-Caucasian) |
85.7% |
84.2% |
42.1% |
60.0% |
.008 [Alc+Tr=Alc>Tr] |
Age |
56.6±5.1 |
56.9±5.4 |
54.4±5.8 |
56.8±7.9 |
n.s. |
Education (years) |
13.0 ± 2.1 |
13.0 ± 2.3 |
14.4 ± 1.5 |
13.4 ± 2.5 |
n.s. |
Lifetime History of Drug Abuse (%) |
66.7% |
78.9% |
47.4% |
48.0% |
n.s. |
Hepatitis C (%) |
47.4% |
46.7% |
5.3% |
34.8% |
.02 [Alc+Tr=Alc=Comp>Tr] |
Beck Depression Inventory-II (BDI-II) Score* |
13.5 ± 8.3; 11 |
8.2 ± 7.9; 4 |
10.6 ± 6.6; 10 |
7.4 ± 7.3; 6 |
n.s. |
Dementia Rating Scale-2 Total Scorea |
134.7 ± 4.4 |
135.5 ± 3.6 |
136.6 ± 5.4 |
137.4 ± 3.8 |
n.s. |
Wechsler Test of Adult Reading (premorbid IQ)a |
84.6 ± 17.9 |
90.3 ± 16.9 |
98.8 ± 15.5 |
92.5 ± 19.3 |
n.s. |
TRAUMA-RELATED DEMOGRAPHICS |
|
|
|
|
|
Trauma Age of Onset |
10.8 ± 4.5 |
-- |
8.5 ± 5.0 |
-- |
n.s. |
Physically/Sexually/Emotionally Abused (%) |
66.7% |
-- |
89.5% |
-- |
n.s. |
PTSD Diagnosis (%) |
23.8% |
-- |
5.3% |
-- |
n.s. |
ALCOHOLISM-RELATED DEMOGRAPHICS |
|
|
|
|
|
Alcoholism Age of Onset |
26.8 ± 13.1 |
20.4 ± 5.0 |
-- |
-- |
n.s. |
Alcohol Sobriety (months) |
12.1 ± 39.3; 0.2 |
25.2 ± 37.0; 0.2 |
-- |
-- |
n.s. |
Lifetime Alcohol Consumption (kg)* |
1177 ± 1165; 727 |
1050 ± 692; 1012 |
78 ± 64; 71 |
68 ± 80; 40 |
<.001 [Alc+Tr=Alc>Tr=Comp] |
HIV-RELATED DEMOGRAPHICS |
|
|
|
|
|
HIV Approx. Age of Onset |
36.2 ± 5.4 |
34.4 ± 9.2 |
33.7 ± 10.9 |
37.5 ± 8.5 |
n.s. |
Length of time with HIV (years) |
20.4 ± 4.7 |
22.5 ± 6.9 |
20.7 ± 8.3 |
19.3 ± 7.1 |
n.s. |
Log Viral Load |
1.8 ± 0.9 |
2.0 ± 0.9 |
1.4 ± 0.2 |
1.8 ± 1.0 |
n.s. |
CD4 Count* |
602 ± 317; 492 |
727 ± 367; 591 |
773 ± 315; 798 |
679 ± 279; 637 |
n.s. |
AIDS Status (%) |
71.5% |
73.7% |
38.9% |
64.0% |
n.s. |
HAART Medications (%) |
85.7% |
94.7% |
94.7% |
96.0% |
n.s. |
*Mean ± SD; median
|
|
|
|
|
|
Table2 Group demographic and clinical data
DOMAIN |
Raw Score |
H+AlcH+Tr |
H+Alc |
H+Tr |
HComp |
Tr X Alc |
Tr Main EffectAlc Main Effect |
INFORMATION PROCESSING SPEED |
Raw Score |
33.43 |
43.45 |
39.90 |
34.42 |
.03 |
.53 |
|
Z-score |
0.143 |
-0.792 |
-0.461 |
0.051 |
|
|
Stroop Word Reading |
Raw Score |
90.27 |
79.89 |
80.57 |
89.16 |
.009 |
.80 |
|
Z-score |
0.092 |
-0.492 |
-0.454 |
0.029 |
|
|
Stroop Color Naming |
Raw Score |
64.49 |
61.30 |
60.70 |
68.44 |
.03 |
.36 |
|
Z-score |
-0.250 |
-0.481 |
-0.525 |
0.038 |
|
|
Digit Symbol |
Raw Score |
40.73 |
41.51 |
40.82 |
44.98 |
.51 |
.34 |
|
Z-score |
-0.332 |
-0.266 |
-0.325 |
0.025 |
|
|
EPISODIC MEMORY |
Raw Score |
16.31 |
21.25 |
15.74 |
22.67 |
.55 |
.001 |
|
Z-score |
-0.628 |
-0.136 |
-0.685 |
0.006 |
|
|
WMS-R Logical Memory II |
Raw Score |
11.74 |
16.93 |
11.14 |
19.08 |
.45 |
.001 |
|
Z-score |
-0.720 |
-0.208 |
-0.779 |
0.004 |
|
|
Rey-Osterrieth Figure–Immediate Recall |
Raw Score |
41.05 |
46.17 |
40.79 |
51.40 |
.48 |
.04 |
|
Z-score |
-0.438 |
-0.210 |
-0.449 |
0.021 |
|
|
Rey-Osterrieth Figure–Delayed Recall |
Raw Score |
41.71 |
46.40 |
39.72 |
46.29 |
.82 |
.18 |
|
Z-score |
-0.203 |
0.015 |
-0.296 |
0.010 |
|
|
acontrolling for age and education blower Z-scores indicate poorer performance
Table3 Results of ANCOVAa analyses of neuropsychological tests comprising significant cognitive domains in HIV-infected participants: with alcoholism and childhood trauma (H+Alc+Tr), alcoholism (H+Alc), childhood trauma (H+Tr), or comparison group with HIV infection (HComp)
DOMAIN |
Raw Score |
H+Alc+Tr |
H+Alc |
H+Tr |
HComp |
Tr X Alc |
Tr Main Effect |
EXECUTIVE FUNCTION |
Raw Score |
98.77 |
137.75 |
113.72 |
95.02 |
.01 |
.37 |
|
Z-score |
-0.079 |
-0.930 |
-0.406 |
0.002 |
|
|
Stroop Color-Word (Interference condition) |
Raw Score |
32.61 |
36.28 |
33.72 |
37.46 |
.99 |
.11 |
|
Z-score |
-0.378 |
-0.073 |
-0.286 |
0.025 |
|
|
Controlled Oral Word Association Test |
Raw Score |
41.60 |
40.14 |
36.71 |
36.49 |
.82 |
.76 |
|
Z-score |
0.384 |
0.278 |
0.029 |
0.012 |
|
|
FINE MOTOR SKILLS |
Raw Score |
70.88 |
71.68 |
67.54 |
72.64 |
.53 |
.39 |
|
Z-score |
-0.031 |
0.012 |
-0.207 |
0.062 |
|
|
Fine Finger Movement–non-dominant hand |
Raw Score |
67.24 |
70.69 |
60.76 |
72.26 |
.24 |
.03 |
|
Z-score |
-0.194 |
-0.013 |
-0.533 |
0.069 |
|
|
Alternated Finger Tapping–dominant hand |
Raw Score |
57.31 |
62.84 |
53.55 |
56.98 |
.65 |
.06 |
|
Z-score |
0.078 |
0.577 |
-0.261 |
0.048 |
|
|
Alternated Finger Tapping–non-dominant hand |
Raw Score |
57.08 |
55.60 |
54.62 |
55.80 |
.54 |
.95 |
|
Z-score |
0.159 |
0.015 |
-0.080 |
0.035 |
|
|
Alternated Finger Tapping – alternating hands |
Raw Score |
64.97 |
61.16 |
58.35 |
63.77 |
.20 |
.82 |
|
Z-score |
0.110 |
-0.100 |
-0.255 |
0.044 |
|
|
Table4acontrolling for age and education
blower Z-scores indicate poorer performance