A Quantitative Analysis of The Similarities and Differences of the HIV/FIV gag genome
Received Date: March 02, 2022 Accepted Date: April 02, 2022 Published Date: April 04, 2022
doi: 10.17303/jaid.2022.9.101
Citation: Charlotte Siu (2022) A Quantitative Analysis of The Similarities and Differences of the HIV/FIV gag genome. J HIV AIDS Infect Dis 8: 1-6.
Abstract
Among viruses, human immunodeficiency virus (HIV) presents the greatest challenge to humans. Here, we retrieved genome sequences from NCBI and were then run through LALIGN bioinformatics software to compute the E value, bit score, Waterman eggert score, and percent identity, which are four important indicators of how similar the sequences are. These 4 values are 3.1 x 10^-9,51.9, 241 and 55.4%.Bases 1600 to 1990 in HIV and bases 800 to 910 in FIV have a higher than normal similarity. This reflects that while the DNA sequences of the gag region of both the HIV and FIV genomes are rather similar, it is unlikely that this similarity is due to random chance; therefore, there are a noticeable number of differences. A better understanding of the level of similarity and differences in the gag region of the genome sequence would facilitate our understanding of structural and cellular behavioral differences between FIV and HIV, and in the long term, it will provide new insights into the differences observed in previous studies or even facilitate the development of an effective HIV treatment.
Keywords: HIV; FIV; gag
Introduction
First discovered in 1983, HIV has infected approximately 80 million people worldwide so far according to data published by the WHO. In 2020, over 680,000 people died from the virus. Despite its deadliness, there is still no effective and specific treatment for this virus. Three years after HIV was first sequenced, scientists were able to discover a similar virus in cats, feline immunodeficiency virus or FIV (Pederson et al,1987) [1]. Like many viruses, both HIV and FIV have gag proteins (Coffin et al, 1997) [1]. The gag protein is known to play an important role in many stages of the replication cycle of a retrovirus. For example, they play an important role in viral assembly, interact with numerous host cell proteins, and regulate viral gene expression. They also provide the main driving force for virus intracellular trafficking and budding and are involved in pathogenicity (Mullers, 2013) [2].
Past studies have suggested that the DNA sequences in both viruses are similar, but it was not clear to what extent the gag genome similarity is. When computed in the DNA analysis and alignment software FASTA, the E value and bit score are good indications of similarity between two sequences. The lower the E value is, the more similar the DNA sequences are, and the less likely this “match” in the DNA sequence is due to random chance. Generally, an E value below 0.01 is considered low. A bit score of 50 or above almost always indicates that the match between two DNA sequences is very significant and similar (Pearson, 2013) [2]. The percent identity is the percent of nucleotides that match exactly and is adjusted for the length of the DNA sequence. A percent identity of 50 percent or more would mean that a majority of the nucleotides match when adjusted for the length of the DNA sequences. The waterman eggert score is a good indicator of sequence similarity too, and previous articles have cited that any score of 37 or above is considered as significant (Bernstein and Churchill, 2021) [2].
Since previous studies have shown that HIV and FIV share similar pathogenesis and the gag protein coded by the gag genome plays an important role in pathogenesis (Friedman et al, 2006), it is hypothesized that the gag region of the FIV and HIV genome should be similar in sequence as defined by the aforementioned standards regarding the E value, bit score, waterman eggert score and percent identity.
Materials and Methods
Preparing the PCR templates
Before HIV and FIV DNA could be sequenced, the DNA samples needed to be amplified by PCR. This could increase the number of copies of the same DNA available for sequencing (Casbon et al, 2011) [3].
In this experiment, the master mix of the PCR consisted of 1 μL of big dye terminator (Table 1), 1.5 μL of big dye dilution buffer (table 1), 0.5 μL of the primer (Table 1), 4.5 μL of the gag DNA (Table 1), and 5.5 μL of molecular grade water (Table 1). This adds up to a total volume of 10 μL. The same recipe was used for both the HIV and FIV gags.
The PCR run
After preparing the master mix, we programmed the standard cycle sequencing protocol on the thermocycler. Step one of the cycles lasted for 1 minute at 96 °C, step 2 lasted 10 seconds at 96 °C, step 3 lasted 5 seconds at 50 °C, and step 4 lasted 4 minutes at 60 °C. The cycler was repeated for 35 times.
purification of the PCR products
After the purification and PCR process, the sample was handed over to a technician to run on an ABI 3100 machine.
Checking the accuracy
The gag genome sequences received were “nucleotide blasted” on NCBI. The BLAST results showed that the sequences were accurate because they showed a 100% match to the HIV and FIV gag genome sequences in their records.
Bioinformatics software analysis
The HIV and FIV gag sequences obtained were entered into FASTA software, a software designed to compare DNA sequences. FASTA software was used to compute the E value, bit score and percent identity of the two sequences. The results were recorded and presented below.
Results
The E value of the overall sequences was 3.1x10^-9, with a bit score of 51.9. The percent identity of the overall sequences was 55.4% whereas the waterman eggert score is 241(Table 2). In addition, exactly aligning the nucleotide bases is shown in figure 1 below.
In addition to calculating the four values we mentioned as “indicators of degree of similarity” in our introduction/ hypothesis, we have one unexpected finding when doing the study. The software alerted us that there is a region in the HIV/FIV genome that special attention is needed, since it shows a striking degree of similarity that can be said as one of the highest in the overall gag genome. It should be somewhere between the base pair 800 to 1,200 in FIV and 1,500 to 2,500 in HIV (Figure 1). With the software’s alert in hand, a FASTA analysis was performed. Unlike LALIGN, the FASTA results show a more specific picture of where this “region of concern” is. The “region of concern” is base 1600 to 1990 in HIV and base 800 to 910 in FIV (Figure 2). The “region of concern” shows a 3.4x10^-10 E value and a 55.1 bit score (Figure 2). Both of these are higher than the overall gag genome.
Conclusions
The gag genomes of HIV and FIV, on a whole, are very similar. While they are generally similar, approximately 46.6 percent of the nucleotide bases do not exactly match. Therefore, we can reasonably conclude that our hypothesis is correct.
Discussion
This discovery of the exact degree of similarity of the HIV and FIV gag genome in this study could pave the way for explaining many other scientific observations referred to in other studies as well as some other new studies to understand more about HIV and FIV.
One example is, the high degree of similarity we mentioned in our study could explain why previous studies have concluded that the FIV and HIV generally share a similar pathogenesis pathway. However, little is known about where in the gag genome is the capsid protein for the FIV and HIV coded for, as well as the capsid protein. It is possible that the “region of significant concern” mentioned above is where the FIV capsid protein’s fundamental structure is coded for, so that might explain why there is evidence that the FIV capsid protein retains the same fundamental structure as the HIV protein (Gonzalez et al, 2018) [4]. In subsequent studies, we can investigate whether this hypothesis is correct or not.
A second example is, other studies have suggested that the FIV matrix is not found as a trimer in the crystal structure (Gonzalez et al, 2018) [5-6]. Existing research shows that there is little similarity in the amino acid sequence of the FIV and HIV protein matrix (Gonzalez et al, 2018). HIV-1 and FIV Gag differ strikingly in a key intracellular trafficking property. FIV Gag is a nuclear shuttling protein that utilizes the CRM1 nuclear export pathway, while HIV-1 Gag is excluded from the nucleus (Kemler et al,2012) [7]. It is possible that the genome that codes for the matrix’s structure or the matrix in HIV and FIV are really different in sequence and could be within the “46.6 percent of dissimilar genomic sequences”. Again, this is what future studies could look at.
In addition to the above, future studies could also try and investigate whether there are regions of the gag genome that show an unusual pattern such as repetition, or even if there is a particular region of the FIV and HIV gag genome that shows unusual differences [8,9].
Therefore, it is clear that this study has given a clearer direction as to where to start or continue with when studying more about the similarities and differences regarding the behavior of gag protein in HIV and FIV, as well as things the gag protein plays a role in such as the matrix structure, capsid structure etc. It is important for us to try and understand more about the gag genome of the HIV and FIV on a molecular level because the more we understand about the gag, the more we understand about the pathogenicity as well as structure of the HIV and FIV, and subsequently how or whether it is possible to apply the kind of treatment we use for the FIV virus to the HIV virus [10,11].
Acknowledgement
We acknowledge Miami University Microbiology department as well as CBFG for providing us with the funding, help and resources needed to complete this study.
Conflict of interest statement
There is no conflict of interest and the content of the manuscript is completely approved by all authors.
- World Health Organization (2022) Number of deaths due to HIV/AIDS. World Health Organization.
- Pedersen NC, Ho EW, Brown ML, Yamamoto JK (1987) Isolation of a T-lymphotropic virus from domestic cats with an immunodeficiency-like syndrome. Science 235: 790-3.
- Cold Spring Harbour. (1997) Retroviruses.
- Müllers E (2013) The foamy virus gag proteins: What makes them different? Viruses 5: 1023-41.
- Miller C, Abdo Z, Ericsson A, Elder J, VandeWoude S (2018) Applications of the FIV model to study HIV pathogenesis. Viruses 10: 206.
- Pearson WR (2013) An introduction to sequence similarity (“homology”) searching. Current Protocols in Bioinformatics 42.
- Sparger EE, FIV as a model for HIV: An overview. In Vivo Models of HIV Disease and Control: 149-237.
- Casbon JA, Osborne RJ, Brenner S, Lichtenstein CP (2011) A method for counting PCR template molecules with application to next-generation sequencing. Nucleic Acids Research 39.
- Kemler I, Saenz D, Poeschla E (2012) Feline immunodeficiency virus gag is a nuclear shuttling protein. J Virology 86: 8402-11.
- González S, Affranchino J (2018) Properties and functions of feline immunodeficiency virus gag domains in Virion Assembly and budding. Viruses 10: 261.
- Root-Bernstein R, Churchill B (2021) Co-evolution of opioid and adrenergic ligands and receptors: Shared, complementary modules explain evolution of functional interactions and suggest novel engineering possibilities. Life, 11: 1217.
FIGURE 1
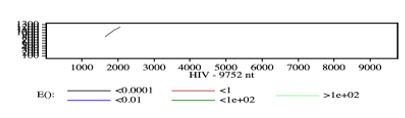
Figure 1: the software indicates that there is a specific region of the DNA in FIV and HIV that requires attention, since the E value is particularly low which means it is very similar and it is unlikely that it is by chance
FIGURE 2
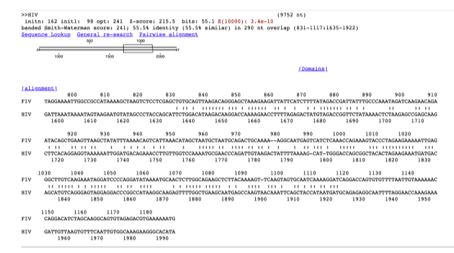
Figure 2: a FASTA analysis of the "region of concern
Tables at a glance
Figures at a glance