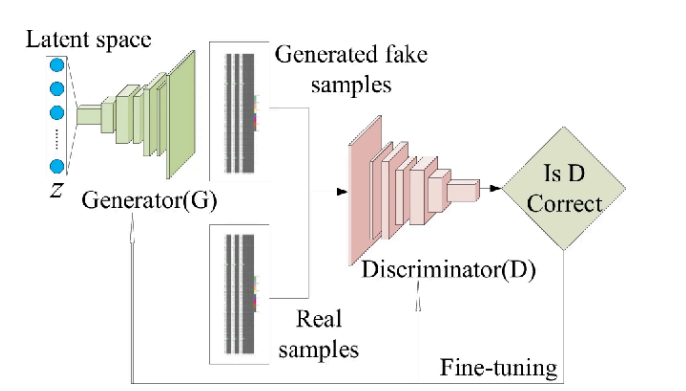
Figure 1: Design network of generative that is based on proficient ability Manufactured information era preparation
Figure 1: Design network of generative that is based on proficient ability Manufactured information era preparation
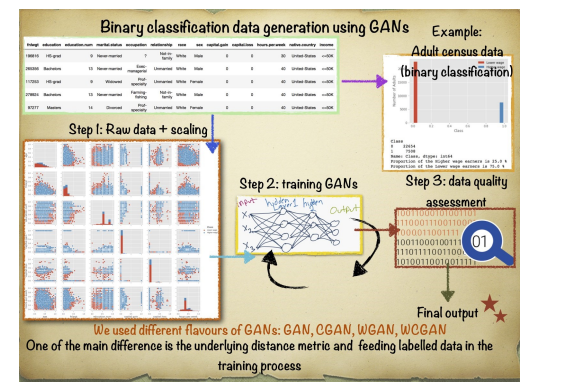
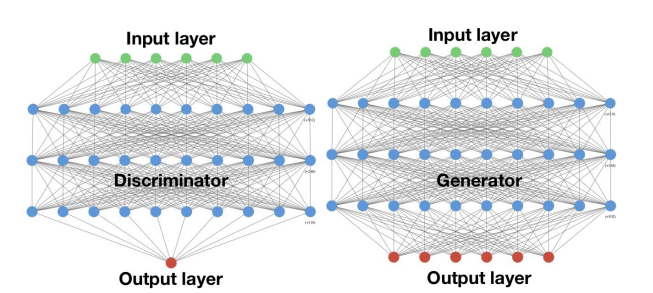
Figure 4: Discriminator and neural network hierarchical architecture used in all four GANs used to generate digital features from the US Census dataset
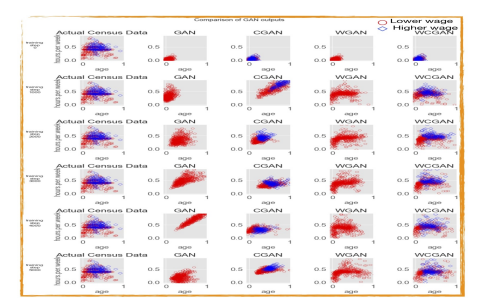
Figure 5: comparing the execution of distinctive GAN structures as a work of the number of preparing steps
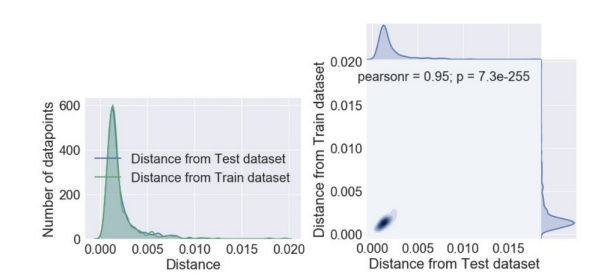
Figure 6: The resulting histogram of the distance between samples and their nearest neighbors during training and testing; Also shown is the combination of two distance distributions
Figures at a glance