The Industry Similarity in Input-Output System of China in 1981-1995: Application of Dual Scaling and Fuzzy Clustering
Received Date: September 10, 2024 Accepted Date: October 10, 2024 Published Date: October 13, 2024
doi: 10.17303/jaist.2024.1.202
Citation: Xue Fu (2024) The Industry Similarity in Input-Output System of China in 1981-1995: Application of Dual Scaling and Fuzzy Clustering. J Artif Intel Soft Comp Tech 1 : 1-23
Abstract
This paper address the evolution of the similarities between industries from 1981 to 1995 in China by applying dual scaling and fuzzy clustering to input-output systems. The dual scaling is applied to set simultaneously in row and column direction to the simple structure Of demand and supply by row and column eigenvector as their weights. Ihe distances Of weight between rows reflects the similarity of the industries in sales profile and that between columns reflects that in purchases profiles. Because of overlap of cluster of industries, network graph analysis and the fuzzy clustering is applied to find the complex similarity between industries. The consistent findings are as follows:
- There are increasing overlap or fuzzy in the similarity in supply and demand with the development Of economy in 1981-1995.
- Supply industries were rapidly specialized and demand was divergence stable over this period;
- Supply industries were rapidly speciali7Æd and demand was divergence stable over this while heavy industry, such as Machinery and Equipment, became the industry with the most similar to other industries both from supply profiles and demand profiles.
Keywords: Input-Output System; Dual Scaling; Similarity; Network Graph.
Introduction
Leontief input-output model is a kind of powerful tools to classify and interpret structure. Based on this model, a lot of methods were developed [1-31, largest engine value and responding engine vector of input-output model reflects the economic system of equilibrium growth rate and structure (Andras Brody, 1997). Because of input-output table is a multivariate categorical data, so the corresB»ndence analysis can used to with the input-output table to get simple structure in multi-dimension. Principle Component Analysis is one way to get the new coordinate system based on eigenvalue. A reassessment of PCA was made in input. output table both in the row cluster (R.mode) and column clusters (Q-mode) by approach of O'Huallachain (1984), the largest engine value in row direction and column direction corresponds the equilibrium rate and price. Dual scaling. presented by Nishisato 14,51, provides a way of mapping out the relative effects of a change in demand or supply in a sector as a whole. When applying it to the input-output table, the eigen value is simultaneously both for row and column, the corresponding eigen vector is the equilibrium structure both demand and supply.
Dual scaling technology is first used by (6) to simultaneously evaluate the important change originating in the demand for inputs (technological condition) and in the supply (market conditions). Taking row and column eigenvector as their weights, the distances of weight between rows reflects the similarity of the industries in sales profile between, and that between columns reflects that in purchases profiles. Similarity tktween rows and columns can reflect the interrelation and betwewn different industries in sale profiles and purchase and specialization. The clusters were able to roughly describe the similarity in industries. To further describe the overlap between these clusters, we first describe the serious of overlap by using the network graph, and then employ the fuzzy clustering to address the evolution of similarity of Chinese input-output system from 1981 to 1995. Utilization of the fuzzy clustering to investigate the similarities between demand industries or supply industries provides a method to descrilk the complex similarity among industries in input-output system.
If describing the similarity relationship between industries in the input-output system as a complex network,the network graph can be used to clarify the complex structure of similarity, of overlap of the complete sub-clusters, the further fuzzy clustering is to discover the more information on the specialization in the sale profiles and divergence in the purchase profiles. Comparing to the [61 two regions comparison analysis, the second feature of my paper is to address the dynamic evolution of the similarities between industries from 1981 to 1995 in China.
presents the link from the due scaling. network graph to fuzzy clustering. In section 3, we start from the analysis of overlap among the clusters using network graph, and then apply the fuzzy clustering to Chinese input- output tables in 1981 -1995 to address the similarity in supply industries and demand industries. We will conclude with a summary of results and further research possibilities.
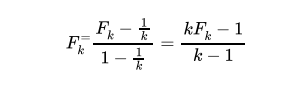
Link from dual scaling, network graph to fuzzy clusteringWhen regarding the input-output table as contingency table. the weights of demand (column) and Supply (row) Obtain simultaneous by application Of dual scaling technology. It is similar to principal components analysis (PCA) for categorical data approach; however, the existence of a dual solution, as will be seen later. makes dual scaling different from the well-known PCA and allows for additional insights. The traditional input-output analysis compared one by one the ripple effect Of a Change in intensity of key industry [7-10] of key elements only in technical block in an input-output System According to the dual scaling method. we can obtain simultaneously of the weight (principle Of Supply industries (row) and demand industries (column). Based on the two dirnensions of weights, further analysis on the similarity Will more precise than tradition analysis one by one, and then the investigation Of association Will the Leontief model and Ghosh model at the Same time. We focus on the former instead of the latter. The more detailed description of this method refers to Appendix- Applied to an input-output table, the weights will be used to obtain clusters in sales profiles and in profiles,' in order to achieve this, we will disregard the primary inputs (last row) and the find demand (last column) from any further analysis.
Clustering [11] is one of the important techniques in Data Mining. Cluster analysis divides data into groups (clusters) such that similar data objects belong to the same cluster and dissimilar data objects to different clusters. The resulting data partition improves data understanding and reveals its internal structure We use the clustering methods to group supply industries or demand industries into clusters. The similarity between two row (or column) weights is defined by a distance function.
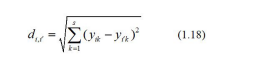
The row (or column) weight matrices can be used to compute two sets of Euclidian distances in the space of dimension s, and inter-rows (inter-columns) distances and rows-columns distances as follows. The inter-rows distances are found by computing the following rxrEuclidian distances:
The inter-columns distances are found by computing the following CXC Euclidian distances:
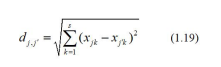
The objective of applying dual scaling is to first find similarities or divergences between sales profiles (rows) and between purchases profiles (columns), Applied to an input. output table, the distance Of weights can explain the relationship Iktween industries. In order to explain this relationship, we Classify the distances Of weights rows and those between columns, and then find the association Of distances Of weights rows and columns. The first type of weight relationship can be analyzed by topology and clusters; the second tyF weight relationship can be analyzed by assignment problem and graph.
Graph theory, so called topology. investigates the mathematical structure which pairwise relationship between from a Certain collection. Euler solved the famous problem of the bridges of Königsberg, which is view as the first result of graph theory, This theory has developed during the Second half Of the 19th century and has since the 1930s. It applies to Computer Science, Operations Research, Game Theory, Decision Theory. Our motivation is explaining relationship between inter-industries by this new theory. We draw a graph consisting of a collection of vertices (referring to industries) and a collection of edge that connect pairs of vertices (referring to the relationship between industries). and then investigate the evolution Of topology structure of the graph standing for the similarity development.
We introduce some definitions and other variations in the types of graphs that are considered in our study, more detailed conceptions refer to (121. Let G be a graph, V(G) the set of vertices of G, E(G) the set Ofedge of G. A simple graph is a graph such that there is at most one edge between any two vertices of G. Let G V (G) , is adjacent of Vi. if ViVj is an edge of G. A path is a subgraph of G, denoted by such that and is adjacent to k — 1. A connected graph is a Vi—l and Vifl,i = 1, 2, graph such that for every two vertices Vj of it there is at least a path from Vi to V). An induced subgraph: Let V' C An induced by Vf subgraph of G such that for every edge e of it the two vertices incidenced with e are in V', denoted by GLV$I. A maximum connected subgraph(i.e. component) of a graph G is a connected subgraph, denoted by , of G such that for Yv V (G) \ V (H), is not a connected. A complete graph, or clique, is a simple graph where an edge connects every pair of distinct vertices. The complete graph on n vertices has n vertices and n(n — l) / 2 edges, and is denoted by Kn. Any subgraph induced by a clique is a complete subgraph. A maximal clique is a clique that is not a subset of any other clique, Let Gi is maximal clique of G, LJ Gi and n Gi are respectively the union and the intersection. A simple graph can be express as the union of all maximal cliques.
To assess the similarities or dissimilarities between sale profiles (rows) or purchase profiles (column), we consider that distances tklow a given threshold are a good indicator of similarity between sectors. The threshold can be fixed arbitrarily; however, in our case we Will fix its level at the 1st quartile, Taking sale profiles for example, we choose the elements under threshold from the row weight distance matrix. Responding to a certain element, its two industries are two vertices (Vi and Vj) with an edge connecting them( eij) standing for the similarities between two industries' sale profiles (row). From all elements under threshold, we draw the responding simple graph, which consist of several connected graph. Some isolated vertices (industries) are not adjacent to other vertices (industries), so they are dissimilar to other industries. The simple graph and those isolated vertices compose a graph G.
From the graphs, we observe the similarities between sale profiles by examining the properties of the graphs.
First. we examine the degree ofa vertex (i.e. the number of edge which touch). The more degree the vertex has, the higher similarity the industry i has to other industries. We sort all vertices in decreasing order of degree and get a degree sequence D(G) (DJ, D2, D s), then according to the maximum vertex degrees, means of degree, variance of degree, and the number of isolated vertices, we infer the industries the most similar to industries, the means and variance of the industries' similarity.
we examine the strength of connectivity in a graph. It can in particular captured by properties of the maximum cliques in the above simple graph. We compute the number and length of maximum clique, and their intersection part. Ihe strength of connectivity can clearly describe the similarity between the sale profiles. The closest similarities in sale profiles are summarized in table l, involved several clusters can be regarded as a set of a labeled maximum cliques with vertex All maximum cliques form a simple graph. Iheir intersection concerns common edges if it is a clique of order n. Thus the order the intersection is O(n2) and is critical to the strength of connectivity of the graph. For example, we analyze the strength of connectivity for sale profiles in 1995. In figure 1, we can observe clearly the intersection of Third, we see the evolution of topology structure. Due to the complexity of graph, we compare the of topology, in particular the intersection of the maximum cliques. From the Figure l. we can see the evolution of similarity in sale profiles from 1981 to 1995. The evolution of purchase profiles is shown in Figure 2.
those in column weight distance matrix stand for the similarities between demand industries (purchase profiles). Based on the distance tables and the chosen threshold we observe the clusters summarized in Tables 1 and Figure I (the initial clusters are provided in Table A.32 in the Appendix).
Similarities in fuzzy classificationFrom Tables 1 and Figure 1 it is clear that there is a overlap in the sets of similarities of both the sales and purchases profiles for the Chinese economies. Since some sectors belong to more than one set of similarities, we referred to postpone the use of the term 'clusters' until we the notions of fuzzy sets and fuzzy logic.
Often, similarity studies and cluster analysis are used for aggregation purvx»ses (Blin and Cohen 1977), where each industry has to belong to a unique cluster: this should not obscure the option about the B)ssibility of overlap in clusters. In order to investigate clusters overlaps, we can use fuzzy theory where set distinctions are not crisp (see Miyamoto 1m; Mirkin 1996).
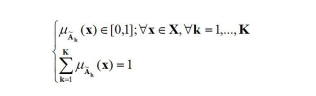
Zadeh (1965) introduced fuzzy sets and fuzzy logic in a celebrated paper. Zadeh, the founder and the most important contributor to the theory, defines a fuzzy set as being "a class of objects with a continuum of grades of membership," Indeed, in fuzzy set theory, unlike in the 19th century Cantorian set theory, elements belong to a set according to a membership function that takes values in the range [0,1] instead of taking a binary value from {0, 1}, making Cantorian sets a particular case of fuzzy sets with memberships of 0 or 1.
Unlike the crisp clustering method, fuzzy clustering is concerned with pattern discoveries between sectors rather than their it is a discovery tool rather than a summarizing or simplification The use Of fuzzy set theory in qnial sciences in general and economics more particularly, helps avoiding certainties in conclusions based on data that might inaccurate because of sample bias or collection errors. Ragin (2000) that the ability of fuzzy sets to explore and express a greater diversity in the data is useful to bring closer data analysis and theoretical mckåels in social sciences, since "fuzzy sets can carefully tailored to fit theoretical concepts".
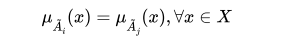
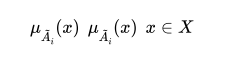
Formally, let X be a reference finite and countable
space of points, where a generic point is denoted by X A
fuzzy set (or subset) A in X is characterized by a real valued
membership function PA(C) that associates with each point
in :reX a value from a real interval usually normalized to
10.11. For notational clarity and to distinguish between fuzzy
sets and crisp sets, it is common to denote a fuzzy set A by
(Kaufmann 1975). The fuzzy subset of X is a set of ordered
pairs 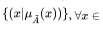 X where
  is the grade or degree
of membership of x in Ä.
is the grade or degree
of membership of x in Ä.

If we denote by  all the subsets of
the universal set Χ, then the following properties always hold:
One reason for the lack of use of fuzzy logic and fuzzy set theory in social sciences may be attributed to the problematic way to determine the shape of the membership function, an issue that has not received sufficient treatment in the literature. Indeed, although assuming an shape for the membership function as it is done when dealing with probability distribution functions—might be convenient for theoretical studies, it constitutes a serious departure from the data's underlying patterns when used for applied work. An example of ad-hoc defined probability distribution is used in Jackson (1986) to estimate technical coefficients in input- output tables. Kaufman and Rousseeuw ( 1m Ch. 4) advance an algorithm. retained in the statistical package S. Plus 20 (MathSoft 1999), to compute the membership values5.
The iterative algorithm proposed by Kaufman and Rousseeuw (199()) consists in classifying r objects (here sectors) in k clusters based on the observation of characteristics, variables, or cbservations Of a variable (here the dual scaling solutions), With the distance computed in (29) for the supply profiles and (30) for the demand profiles, for each sector i and cluster k there Will be a membership value that solves the following program:
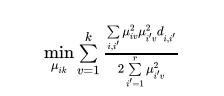
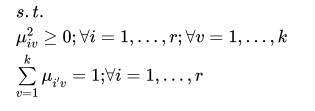
It allows a maximum number of clusters ,  where in our case n is the number of industries (i.e., the size
of the technical block). Aside from numerical considerations
proper to the algorithm, the maximum number of clusters is
where in our case n is the number of industries (i.e., the size
of the technical block). Aside from numerical considerations
proper to the algorithm, the maximum number of clusters is
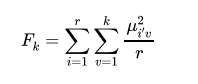
set so as no sector represents a unique cluster and that the number of sectors is not equal across clusters. However, the optimal number of clusters has to minimize the objective value in (11). To assess the fuzziness of the resulting cluster Dunn's partition coefficient is computed:
with  such that for entirely fuzzy clustering
  and for entirely crisp sets
 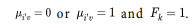 A normalized Dunn's coefficient taking values from [0,1] is computed by:
The objective Of applying dual scaling is to find similarities or divergences between sales profiles (rows) and between purchases profiles (columns), Applied to an input output table, the distance of weights can explain the relationship between industries. In order to explain this relationship, we classify the distances of weights rows and those between columns, and then find the association of distances of weights between rows and columns. The first type Of weight relationship can be analyzed by topology and clusters; the type weight relationship can be analyzed by assignment problem and graph.
Overlap in clustersUsing the row and column weights Solutions, we can compute the Euclidian distances between pairs of row weights and then the Euclidian distances between pairs of column weights as in the distance matrices. The closest similarities under threshold are summarized into a set of clusters shown chronologically in table 1.
The table 1 shows each set of clusters may have overlap sub-cluster. To observe intuitionally. they are shown as the simple graphs consisting 18 nodes (industries) and edges connecting the two industries, the distance of which are under thresholds. 'Ihe similarity evolution is shown in Figure 1 for the sale profiles and in Figure 2 for purchase profiles. In order to show the overlap in the largest degree. we observe the maximum intersected cluster overlapped by the maximum clusters, From the evolution of clusters and their maximum intersection parts, we find is that production trcame rapidly specialized and requirements were gradually divergent from 1981 to 1995. As to the sale profiles, the number of maximum cluster increase from 5 in 1981 to 8 in 1995, most of orders of maximum cluster are 6-7 in 1981, while those in 1995 are about 3. The marketable degree is weak in the early of 1980s, production structure is simplified so that supply industry is similar, and. With the development Of market economy, the industries were increasingly specialized, so there were many small groups of industries, which were increasing similar in supply profiles. This is can be prove by searching the maximum intersection clique of the variety of combination of aforementioned maximum cliques. We stand out the intersected cluster with maximum order, and their parent cliques by star. The maximum of intersected clusters is marked by the + line, and the parent cliques are marked with different colors. In intersected maximum clusters, the core of supply industries are consistent over the whole period, they concern about the fundamental industries and heavy industries, such as, Agriculture, Machinery and Equipment, Foodstuff, and Commerce and Catering Trade.
As to the purchase profiles, industry similarity is more stable. Although the number of maximum clusters are higher than supply profile in 1981, but it is more stable and less influence by non-market factors. With the development of market economy, most industries similarity increase the stable and were involved the requirement of households, such as industry l, 6, 8, 15, and 17. Because of divergence, the interusected cliques were less than that of supply profiles. From Figure 2, we find that the core industries in purchase profiles, are the heavy industry 7, agriculture, and commerce became the core of industries with similar demand. In intersected maximum clusters, the core of demand industries is inconsistent over the whole period, they convert from the Agriculture, Transportation, Post and Telecommunications, and Commerce and Catering Trade to the heavy industries, such as Machinery and Equipment, Building Materials and Nonmetal Mineral Products. The reason is the requirement in the early of 1980s are plodding, while heavy industries developed to the important industries and investment demand Ikcame the main derive of development of economy.
Network graph is promoted to address the degree of overlaps between these clusters According to graph theory, we draw network graphs Of both sale profiles and purchase profiles under threshold of distance among the row weights and column weight The network graph consists of a set of points called vertices (singular is vertex) connected by lines called edges. Network analysis has emerged as a key technique in modern economics and sociology, and study complex sets of relationships (Stanley and Katherine, 1994). The row and column weight distance connote the similarity between the supply industries and demand industries. From a set of network graphs chorological, we analyze the evolution of Chinese industry similarity in 1981-1995.[141 merely gave the clusters whose distances are below threadholds. As for more detailed industries over long period, it is not enough to clarify the complexity of similarity. It is necessary to address the property of graph, including the statistic index of degree, and marking the maximum cliques and their intersections. These analyses will offer more clear explanation of evolution of similarities among the supply industries and demand industries.
The fuzzy clustering of similarity of Chinese industry similarity in 1981-1995The overlap between the clusters requires the further fuzzy clustering. We address the similarities or divergences between sectors of supply (rows) or demand (column) by fuzzy clustering [121 analysis the similarity for 10 industries two regions by means of fuzzy clustering tkcause there is overlap in the clusters with the closest distance. We survey fuzzy clustering in 18 detailed industries over long from 1981 to 1995. Before analyzing the fuzzy clustering. we are required to clarify whether they overlap in the similarity clusters with closest distance. Each cluster means clump, of which the nodes are similar to each other for the sale profiles (or purchase profiles).
Similarities in fuzzy classificationFrom above analysis, it is clear that there is a overlap in the sets of similarities of both the sales and purchases profiles for the Chinese economies.
Applying the above algorithm to the sales and purchases profiles of the China provides the memberships to six fuzzy sets. the maximum number of sets was chosen by the algorithm, However, lowering the number of sets to five, for example, proved to yield non.optimal values to the objective function in (l l). The membership values are provided in Tables A-2- A. 3 of the Appendix. One way to compare the overall clustering observed for the China from 1981 to 1995 is to look into Dunn's index in Table 2. In Table 2, Dunn's index suggests that indeed the clusters are lower fuzzy for China (0.29-0.39 for sale and 0.38 for purchase) comparing US ( 0.24 for sale and 0.21 for purchase) and Canada (0.21 for sale and 0.13 for purchase); further, the table indicates that, as for the sales profile, the degree of fuzziness in the clustering slowly decrease from 0.3886 in the early of 1980s' to 0.3888 at the end of and suddenly became greatest in 1990 (0.2948), and then come back quickly to 0.3796 in 1995, and as for purchase profile, the degree of fuzziness in clustering from increase gradually from 0.3820 in 1981 to 03827 in 1995 but became lowest in 1990 in contrast. In addition to being a supplemental proof of the inappropriateness of the use of crisp clusters for comparative studies, Dunn's index that the difference in fuzziness implies the difference in specialization and market degree in Chinese industries between supply and demand. Excluding the non-market factor, the supply of Chinese industries became more and more specialized and marketable from the early to the end of 190s. It suddenly became lowest around 1990 due to non-market factor and then quickly recovered high again. Comparing to the former, the demand of Chinese industries also gradually deepened the specialized and marketable degree and more stable to be influenced by the non-market factor over the same perid As known, China implemented market economy since the end of 1970's or the early of 1980's. The result reflects that before 1995 Chinese market economy was weak but it destined to intensi$', in addition, it was an asymmetric between supply and demand. the degree of state-owned was high, thus supply are apt to be affected by non-market factor comparing to demand. Indeed, the existence of overlaps in the clusters is an indicator of the difficulty of drawing a line separating economic sectors that belong to different clusters, or to HilariZß industries. It implies that supply of industries in China evolved more similarity with each other than the demand of industries 1980-1995.
At the cost of a loss of information, we can force each sector to belong to the set in which it holds the highest membership and look for the closest neighbor to that set; we obtain a "forced" classification as shown in Tables 3.
Table 3 shows that the of sales profiles and purchase profiles for the China are mainly, however not exclusively, represented by clusters A1 (including the agriculture, Minerals and metals and Production and supply Of electric power, Steaming and Hot water) and AS (including Construction, Commerce and Catering Trade, and Primary input). While the purchases profiles are well represented by Clusters A1, and AS. A1 mining and Table 5, for the Canadian economy, shows that the sales profiles are well represented by clusters A1, A2, and A3, while the purchases profiles are mainly represented by clusters A1 and A2. The results of Tables 4 and 5 come in confirmation to the Dunn's index values.
Zadeh (1965), in addition to introducing the notion
of fuzziness in set theory, introduced elementary operation
on fuzzy sets, such as equality, complementation, inclusion,
intersection, and union. Consider the following two fuzzy subsets  functions are
Equality, The subsets  are said to be equal
if and only if their membership functions
are said to be equal
if and only if their membership functions  are equal for all
Complementation. The complement of a fuzzy set 
denoted by  has a membership function:
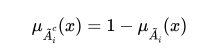
However, since fuzzy logic violates the excluded middle principle, the intersection of a fuzzy set and its complement does not produce necessarily the empty set.
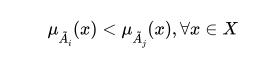
Inclusion or containment. The subset  is included or contained in
  and denoted by
  if and
only if
if and
only if
Intersection. Ihe intersection Of two fuzzy sets is a fuzzy set  whose membership function is defined as:
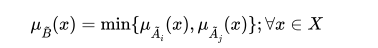
expression (17) can also be abbreviated by: 
If we refer to Tables A.2 and AS for the function derived from the algorithm suggested by Kaufman and Rousseeuw (190, we notice no equality between the fuzzy sets in the sales profiles and the purchases profiles. From Tables and A,3, it is easy to check for the complementation property. and the absence of inclusion in all sets. Unlike the equality between fuzzy sets, the existence of inclusion raises issues of redundancy of the inner set, that efficient algorithms are expected to avoid producing when dealing with fuzzy cluster analysis,
In fuzzy sets, the intersection and union operation offers attractive features, such as the detection of particular import industries in sales and purchases profiles. In Table A. 4 and A. 5. we provide the number of the intersection and union sets membership functions for the sales and purchases profiles for China from 1981 to 1995. The numerical value of membership is between 0 and I and their difference is too
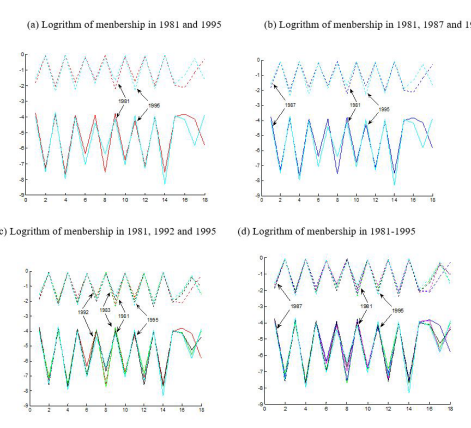
small to distinguish. Graphing with a logarithmic scale yields the benefit that shows very small value on with a minimum of digits on the graph. Using logarithm along 2, we give a graphic representation with logarithm of the intersection and union sets of membership functions for the sales and purchases profiles for China from 1981 to 1995 in Fig. 3 and Fig, 4. From these figures, we get the same relationship with the original intersection and union sets of membership. To more clearly observe the evolution of memtkrship features of industries, we show l»th of Figs. 3 and Figs. 4 as the four figures. In figure (a), two line refer to the values after logarithm transformation in 1981(red), and 1995(cyan). Then that in 1987 (blue) is added in figure (b), and that in 1992(black) is added in figure (c), Figure (d) show all the value including that in 1983 (green) and that in (magenta). From the four figures, it finds that the values after logarithm transformation from 1985 to 1992 are mostly gradually change between that in 1981 and that in 1995. The only unexpected values in 1990 are strange because of non- marketable reason.
For sales profiles, Figure. 3 reveals that the sectors have a very low membership in the intersection Of the fuzzy clusters of the sales profiles and a very high membership in the union of all fuzzy clusters. From Figure 3 the specialized industries are not as important jointly to all the clusters. 'This Strong contrast in memberships shows that: in 1981, those industries 14 OT I, 4 COK and 12 LTR are not as important jointly to all the clusters as they are important to its own clusters 7, 2, and 6 respectively; in 1995, those industries 4 COK, 12 LTR and 2 MTG are not as important jointly to all the clusters as they are important to its own clusters 2, 6, and I respectively (see Fig.3 (a)). Industry 4 COK provides for SFcial industries more than 3
PWP and OIL although they are energy industries; 12 LTR provides more specialized product more than 11 WVI; with the development of industrialization, 2 MTG became the specialized supply industry, while 14 OTI greatly reduced the degree of specialization comparing to that at the beginning of implement of market economy. The heavy industries, i.e. 6 CHM, 7 MEC, 8 CMI, energy industries, i.e. 3 PWR and 5 OIL, construction (15 CST) and services, i.e. 16 TRN, 17 BFI, and 18 NMP, are more important jointly to all the clusters than the light industries, such as, 10 FDI and 12 1-TR. Therefore, the supply of those industries may involve in the industries of a lot of industries, For example, providing cost of energy in industry 5 OIL increase, since it belongs to more clusters; its sales will influence more industries.
We know the important industries if we compare the changes in the relationship between intersection and union of membership from1981 to 1995. For most of industries, intersection of membership became larger and union of membership became less for most industries. It means these industries supply their products to other industries in more similar structure because they are closely bound up with each other more and more. However, the similarity of sale profiles is opposite for industry 2 MTG and 10 FDI, The two industries generally provide more particular prikiucts to special industries. In contrast, the energy industries, i.e. 3 PWR, 5 OIL have the largest increase in intersection and decrease in union simultaneously. It means that the two energy industry became important because the degree of similarity to all other industries is increased mostly from 1981 to 1985.
From the figures (b)-(d), it finds that the evolution of similarity increasingly speeds up. For most industries, the line of 1987 was going more near to that in 1992 than that in 1981 (see fig(b)); and the closeness of line between 1983 and 1981 is small than that between 1995 and 1992 (see fig(c)). It is more appearance for industry 14 OTI and 8 CMI. It means the most sale profiles accelerate the speed of similarity for these industries. From fig. (d), the state is instable state in 1990 due to non-market factor, services are in particular instable in similarity, such as 16 TRN, 17 BFI and 18 NMP.
For purchase profiles in Fig. 4, the industries with divergence demand have a very low membership in the intersection of the fuzzy clusters of the sales profiles and a very high membership in the union of all fuzzy clusters. This strong contrast in memberships shows that: in 1981, those industries 14 OTI. 4 COK and 8 CMI are not as important jointly to all the clusters as they are important to its own clusters 7, 2, and 4 respectively; in 1995, those industries 14 OTI, 4 COK, and 2 MTG are not as imB)rtant jointly to all the clusters as they are important to its own clusters 7, 2, and 1 respectively (see Fig.4 (a)). As upstream industries, raw mineral 4 COK and 2 MTG demanded for special prcxiucts; as downstream industries, industries 14 OTI and 12 LTR demanded distinguished comparing with the most industries. With the improvement of living standard and exploration of new materials, the purchase became increasingly divergent especially for raw material industries, i.e. 2 MTG, 4 OIL and 6 CHM, and for the consumption industries, i.e. 14 OTIS 12 and 10 FDI. are more important jointly to all the clusters in purchase profiles for the primary industry (l AGR) and many basic industries (i.e. 6 CHM, 7 MEC), principle energy industries (i.e. 3 PWR and 5 OIL), construction (15 CST) and services (i.e. 16 TRN, 17 BFI). lherefore, the demand of those industries may be more similar and involve in a lot of industries.
We know the demand change of these industries if we compare the changes in the relationship between intersection and union of membership from1981 to 1995. The tendency of purchase profiles is contrary to those of sale profiles, For most Of industries, intersection Of membership became small and union of membership became large. It means these industries divergence their demand for other industries with the advance of society. The demand divergence changed significantly especially for modern material industries, namely 6 CHM, and the manufactures, 14 OTL However, the purchase profiles are more important to other clusters for industry 8 CMI, 11 TEX and 3 PWR. The three industries generally developed greatly and demand for the general products from the most of industries.
Conclusion
The paper addresses the industry similarity by fuzzy logic approach for the sale profiles and purchase profiles from 1981 to 1995 in China.
On basis of dual scaling, the priority in both of supply and demand can be calculated according to the 1981-1995 Chinese input output tables. Then we calculate the distance of weights of row or column between different industries. The closest distance under threshold shows the clusters of similarity of sale profiles and purchase profiles. The fuzzy clustering is employed in finding similarity and dissimilarity as well.
Both of them have given the consistent conclusion:
- There is more overlap or fuzzy with the development of economy in 1981-1995.
- Supply industries were rapidly specialized and demand was divergence stable over this while heavy industry, such as Machinery and Equipment, became the industry with the most similar to other industries both from supply profiles and demand profiles.
- The purchase profiles evolved more stable than supply profiles when facing non-market factor.
- Sonis M, Hewings GJD (1993) Hierarchies of regional sub-structures and their multipliers within input. output systems: Miyazawa revisited, Hitotsubashi Journal of Economics 34: 33-44.
- Sonis M, Hewings GJD (1992) Coefficient change in input-output models: Theory and applications. Economic Systems Research 4:143-57
- Sonis M, Hewings GJD, Guo J (2000) A new image of classical key sector analysis: Minimum information decomposition of the Leontief inverse. Economic Systems Research 12:401-23 sale profiles in 1995.
- Nishisato S (1980) Analysis of Categorical Data: Dual Scaling and its Application (Toronto, University of Toronto Press).
- Nishisato S (1980) Analysis of Categorical Data: Dual Scaling and its Application (Toronto, University of Toronto Press).
- Dridi C, GJD Hewings (2003) Sectors associations and similarities in input-output systems: An application of dual scaling and fuzzy logic to Canada and the United States, The Annals Regional Science 37:629-56.
- Rasmussen PN (1956) Studies in Inter-Sectoral Relations (Amsterdam, North-Holland).
- Cella G (1984) The input- output measurement of interindustry linkages, Oxford Bulletin of Economics and Statistics 46: 73-84.
- Cella G (1986) The input- output measurement of interindustry linkages: a reply, Oxford Bulletin of Economics and Statistics, 48: 379-84.
- Clements BJ (1990) On the decomposition and normalization of interindustry linkages, Economics Letters 33: 337-40.
- Tryon RC (1939). Cluster Analysis. Edwards Brothers.
- JA Bondy, USR Murty (1976) Graph Theory with Applications. Elsevier North-Holland.
- Wasserman, Stanley, Faust, Katherine (1994) Social Networks Analysis: Methods and Applications. Cambridge: Cambridge University Press.
- Dridi C, GJD Hewings (2002) An investigation of industry associations, association loops and economic complexity: application to Canada and the United States, Economic Systems Research 14: 275-92.
- Aldenderfer MS, Blashfield RK (1984) Cluster Analysis, Sage Publications, Newbury Park, Cal.
- Hirschman AO (1958) The Strategy of Economic Development (New Haven, CT, Yale University Press).
FIGURE 1
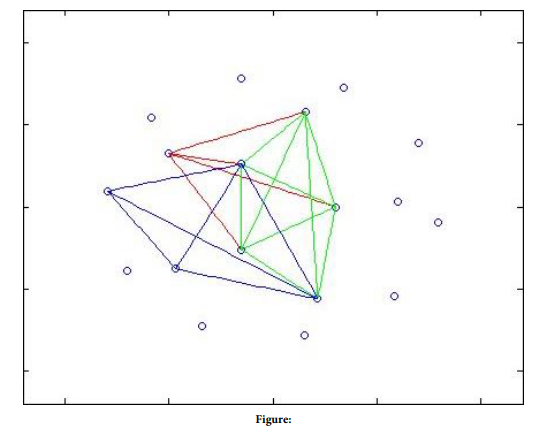
Figure 1:
FIGURE 2
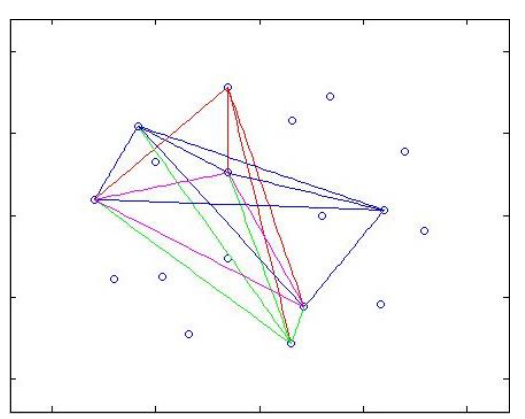
FIGURE 3
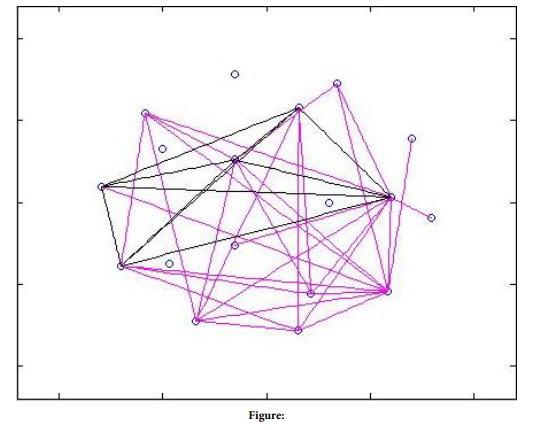
FIGURE 4
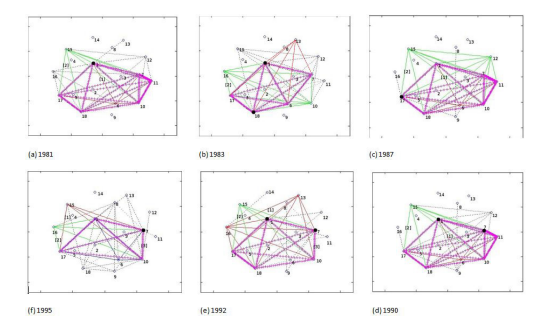
Figure 4: The evolution of similar in sales profiles
FIGURE 5
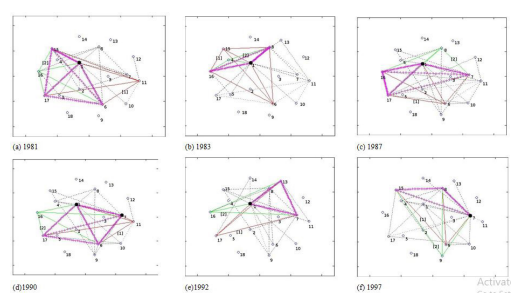
Figure 5: The evolution of similar in purchase profiles
FIGURE 6
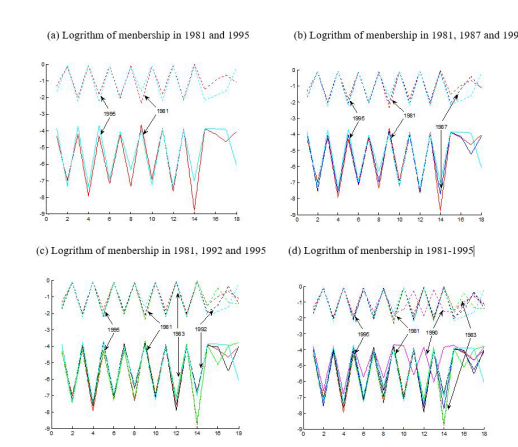
Figure 6: Logrithm of Intersection and Union operation on China fuzzy clusters 1981-1995 for sale profiles
FIGURE 7
Tables at a glance
Figures at a glance