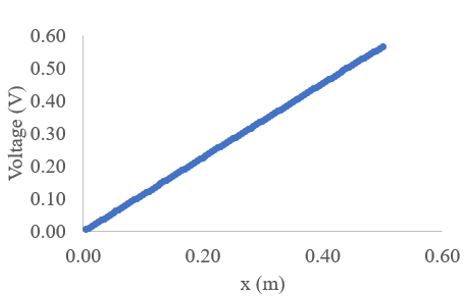
Figure 1: The voltage variation along the grid points. Here concentration is 1000 mM. This is data of training set 1.
Figure 1: The voltage variation along the grid points. Here concentration is 1000 mM. This is data of training set 1.
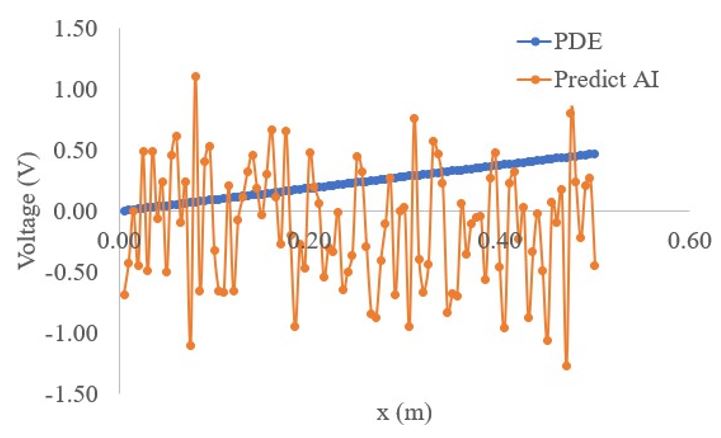
Figure 2: shows the comparison of the predict and PDE voltage variation with the grid points for the multimeter. The test concentration is 1200 mM. Here we use epoch = 200.
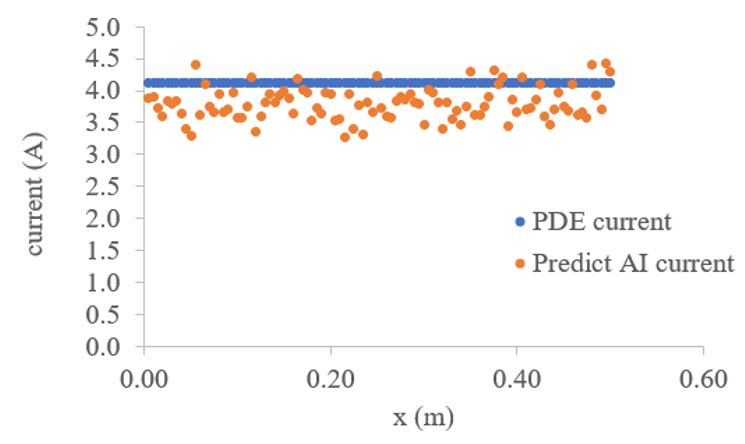
Figure 3: shows the comparison of the predict and PDE current variation with the grid points for the multimeter. The test voltage is 11 V. Here we use epoch = 200.
Tables at a glance
Figures at a glance