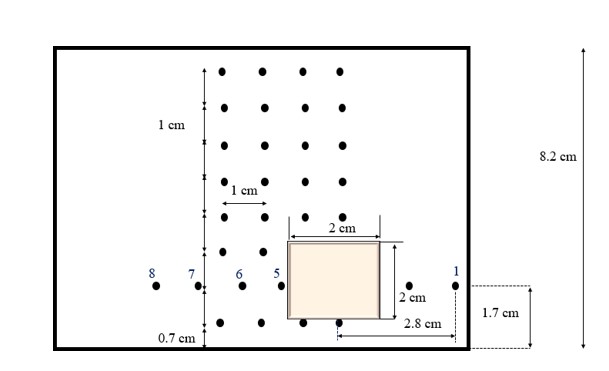
0 to 12 V controller using knob turns. Also read Table 2.
DC motor having rollers
see Table 3.
acrylic base
electrical wirings
terminals for the voltage measurement of the SMPS
multimeter wiring plugged for this purpose
terminals for the voltage measurement of the controller
multimeter wiring plugged for this purpose
terminals for the voltage measurement of the motor
multimeter wiring plugged for this purpose
terminals for the current measurement of the motor
multimeter wiring plugged for this purpose
All terminals are placed on the acrylic base. Electrical wirings are available
chart papers are placed on the acrylic table
Many
books are placed next to the acrylic device unit to match the height.
three books
Single polystyrene is placed on the chart paper
see Table 4 for the dimensions of the polystyrene studied. We study single size.
Digital temperature sensor
Measure room temperature and ensure environment control by
performing the experiments at same temperature
Plastic scale, digital vernier
Measure the size of the polystyrene
caliper and micrometer
Table1: Equipment List to Study the Single Polystyrene Dynamics
Table 2
knob turns in the controller
voltage of the motor (V)
3
1
4
2
5
3
6
4
7
5
8
6
9
7
10
8
Table2: The Relation Between the Controller Knob Turns and the Voltage.
Table 3
Voltage
12 V DC
Diameter
26 mm
Speed
18000 rpm
Shaft type
Round type
Shaft length
12 mm
Shaft Diameter
2.3 mm
Total body length
5.7 cm
Current
1.2 A
Table3: Parameters of the DC Motor
Table 4
Polystyrene
Trial1 (mg)
Trial2 (mg)
Trial3 (mg)
Trial4 (mg)
40
50
34
40
Table6: Mass of the Polystyrene with Repeats. We Keep Acrylic Shield to Obtain Steady Mass.
Table 5
voltage on the motor (V)
current on the motor (A)
power on the DC motor (W)
time (s)
Maximum distance movement of single polystyrene represented as position (m)
5
0.85
4.25
0
0
5
0.85
4.25
7
0.002
Table 7: Single Polystyrene Distance-Time Measurements for Applied Power of 4.25 W. The Power is Applied from DC Motor Having Rollers.
Table 6
voltage on the motor (V)
current on the motor (A)
power on the motor (W)
time (s)
distance (m)
6
0.89
5.34
0
0
6
0.89
5.34
5
0.001
6
0.89
5.34
20
0.003
6
0.89
5.34
27
0.01
Table8: Single Polystyrene Distance-Time Measurements for Applied Power of 5.34 W.
Table 7
voltage on the motor (V)
current on the motor (A)
power on the motor (W)
time (s)
distance (m)
7
0.92
6.44
0
0
7
0.92
6.44
7
0.002
7
0.92
6.44
10
0.008
7
0.92
6.44
12
0.012
7
0.92
6.44
16
0.02
Table 9: Polystyrene Distance-Time Measurements for Applied Power of 6.44 W
Table 8
voltage on the motor (V)
current on the motor (A)
power on the motor (W)
time (s)
distance (m)
8
1.04
8.32
0
0
8
1.04
8.32
1
0.005
8
1.04
8.32
3
0.01
8
1.04
8.32
4
0.02
8
1.04
8.32
5
0.03
Table 10: Polystyrene Distance-Time Measurements for Applied Power of 8.32 W.
Table 9
P (W)
Npolymers
m (kg)
time (s)
a (m/s2)
experiment distance (m)
theory distance (m)
4.25
1.46E+10
3.40E-05
0
0
0
0
4.25
1.46E+10
3.40E-05
7
2
0.002
0.002
Table 11: Comparison of Single Polystyrene Solid Transport Between Experiments and Theory. We Use 4.25 W.
Table 10
P (W)
Npolymers
m (kg)
time (s)
a (m/s2)
experimen t distance (m)
theory distance (m)
5.34
1.46E+10
3.40E-05
0
0
0
0
5.34
1.46E+10
3.40E-05
5
5.38E-02
1.00E-03
1.00E-03
5.34
1.46E+10
3.40E-05
20
7.18E-02
3.00E-03
3.00E-03
5.34
1.46E+10
3.40E-05
27
2.90E-02
1.00E-02
1.00E-02
Table 12: Comparison of Single Polystyrene Solid Transport Between Experiments and Theory. The Power is 5.34 W.
Table 11
P (W)
N polymers
m (kg)
time (s)
a (m/s2)
experimen t distance (m)
theory distance (m)
6.44
1.46E+10
3.40E-05
0
0
0
0
6.44
1.46E+10
3.40E-05
7
0.0455
0.002
0.002
6.44
1.46E+10
3.40E-05
10
0.0162
0.008
0.008
6.44
1.46E+10
3.40E-05
12
0.013
0.012
0.012
6.44
1.46E+10
3.40E-05
16
0.0104
0.02
0.02
Table 13: Comparison of Single Polystyrene Solid Transport Between Experiments and Theory. We Apply 6.44 W.
Table 12
P (W)
Npolymers
m (kg)
time (s)
a (m/s2)
experimen t distance (m)
theory distance (m)
8.32
1.46E+10
3.40E-05
0
0
0
0
8.32
1.46E+10
3.40E-05
1
0.00335
0.005
0.005
8.32
1.46E+10
3.40E-05
3
0.00503
0.01
0.01
8.32
1.46E+10
3.40E-05
4
0.00335
0.02
0.02
8.32
1.46E+10
3.40E-05
5
0.00279
0.03
0.03
Table 14: Comparison of Single Polystyrene Solid Transport Between Experiments and Theory. We Apply Power 8.32 W.
Table 13
time (s)
experiment distance (m)
DDNN model distance (m)
residual ®
(R)2
0
0
5
0.001
20
0.003
27
0.01
(predict) 3.96e- 2
0.0296
0.00087
Table 15: Comparison of Single Polystyrene Distance Time Between Experiments and Data Driven Neural Network. The Power is 5.34 W.
Table 14
time (s)
experiment distance (m)
DDNN model distance (m)
residual ®
(R)2
0
0
5
0.002
10
0.008
12
0.012
16
0.02
(predict)1.83e-2
0.17
0.0289
Table 16: Comparison of Polystyrene Distance Time Between Experiments and DDNN. The Power is 6.44 W.
Table 15
time (s)
experiment distance (m)
DDNN model distance (m)
residual ®
(R)2
0
0
1
0.005
3
0.01
4
0.02
5
0.03
(predict) 3.16e-2
0.0016
0.00000256
Table 17: Comparison of Polystyrene Distance Time Between Experiments and DDNN. The Power is 8.32 W.
Table 16
time (s)
theorey distance (m)
DDNN model distance (m)
residual ®
(R)2
0
0
7
0.001
20
0.003
27
0.01
(predict) 3.96e-2
0.0296
0.00087
Table 18: Comparison Between Theoretical Distance Time Traveled by Polystyrene and Physics Informed from Theory Incorporated in the Experiments. The Power is 5.34 W.
Table 17
time (s)
theorey distance (m)
PINN model distance (m)
residual ®
(R)2
0
0
7
0.002
10
0.008
12
0.012
16
0.02
(predict)1.83e-2
0.17
0.0289
Table 19: Comparison of Polystyrene Distance Time Between Theory and PINN. The power is 6.44 W.
Table 18
time (s)
theory distance (m)
PINN model distance (m)
residual R
(R)2
0
0
1
0.005
3
0.01
4
0.02
5
0.03
(predict) 3.16e-2
0.0016
0.00000256
Table 20: Comparison of Polystyrene Distance Time Between Theory and PINN. The Power is 8.32 W.
Figure1: Schematic Representation of the Polystyrene in the Area
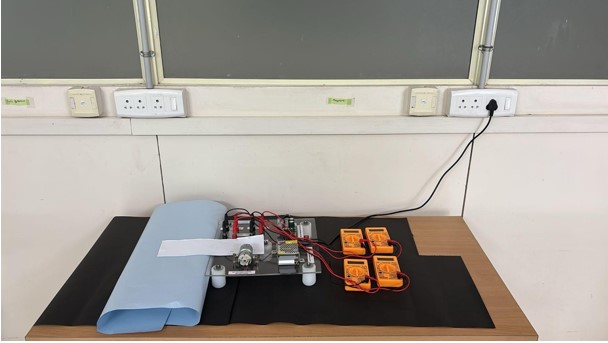
FIGURE 2
Figure2: Experiment set up
FIGURE 3
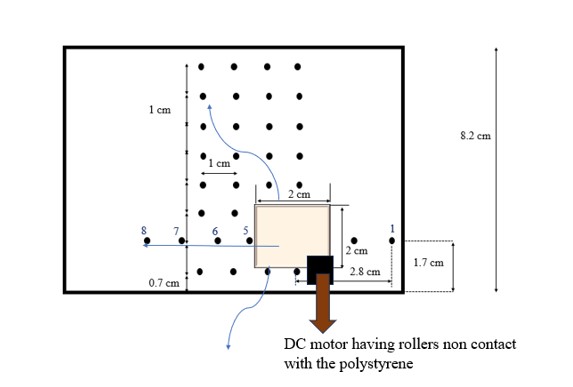
Figure 3: Schematics of Transport of Polystyrene with Time Under the Application of DC Motor Having Rollers. The Polystyrene Moves cm Distance for our Study.
FIGURE 4
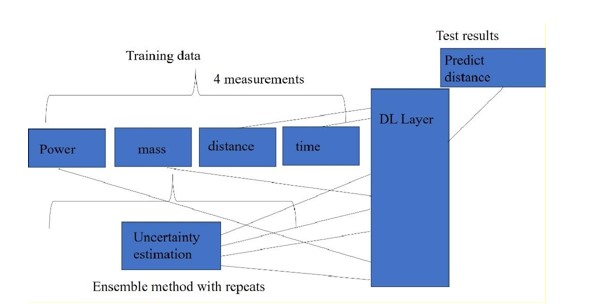
Figure 4: Network Architecture of the Data Driven Neural Network
FIGURE 5
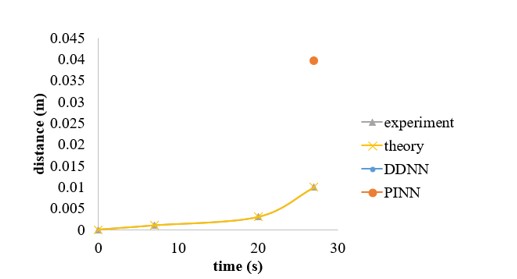
Figure 5: Comparison of Polystyrene Distance Traveled for P = 5.34 W. We have Experiments, Theory, DDNN and PINN Neural Networks
FIGURE 6
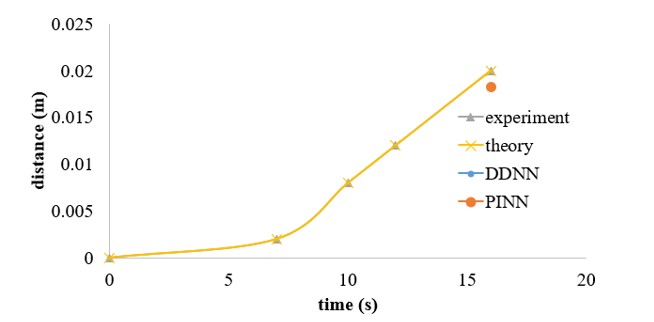
Figure 6: Comparison of Polystyrene Distance Traveled for P = 6.44 W. We have Experiments, Theory, DDNN and PINN Neural Networks
FIGURE 7
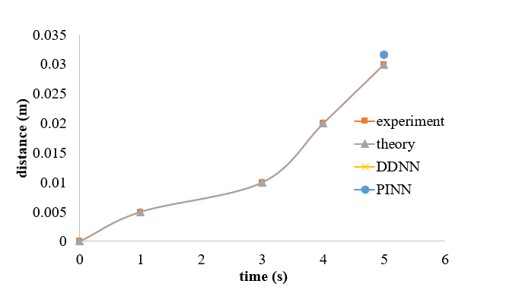
Figure 7: Comparison of Polystyrene Distance Traveled for P = 8.32 W. We have Experiments, Theory, DDNN and PINN Neural Networks
FIGURE 8
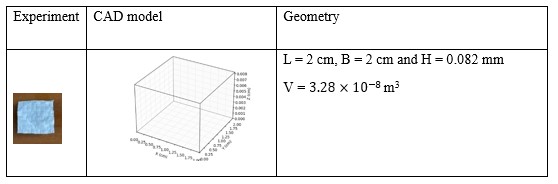
Table 4: Single Polystyrene Geometry, CAD Model and Image
FIGURE 9
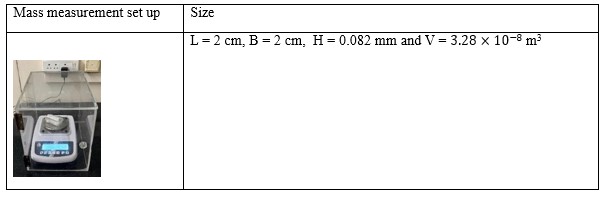
Table 5: Mass Measurement of Single Polystyrene. The Mass Balance is Protected with Acrylic Shield
Tables at a glance
Figures at a glance