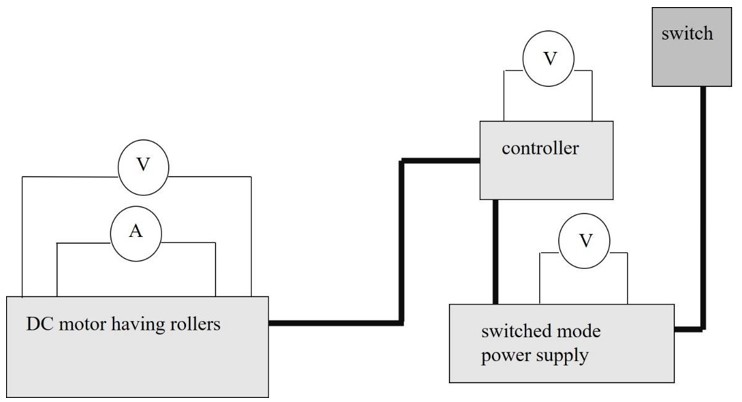
Figure 1: Schematic set up of the Device
Figure 1: Schematic set up of the Device
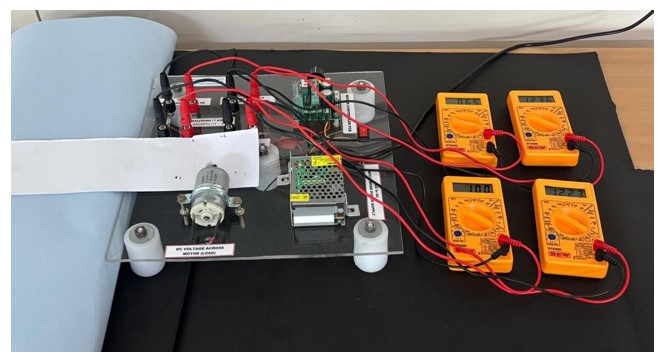
Figure 2: Experiment set up of the Device
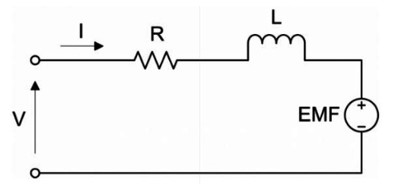
Figure 3: The Circuit Diagram Having the Armature Current, Resistance, Voltage, Load DC Motor and Back Electromotive Force
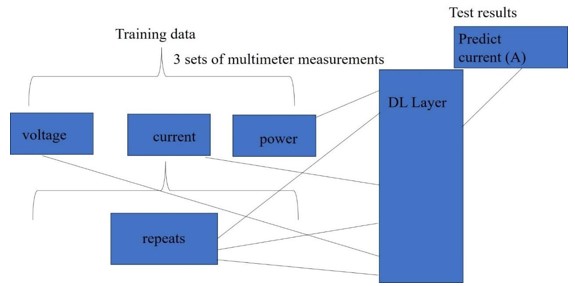
Figure 4: Schematic of Data Driven Neural Network
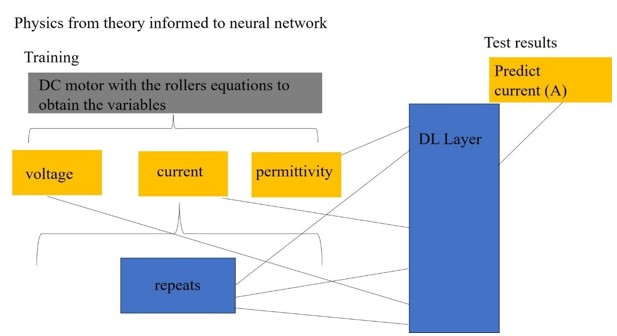
Figure 5: Schematic of Physics from theory informed in the neural network
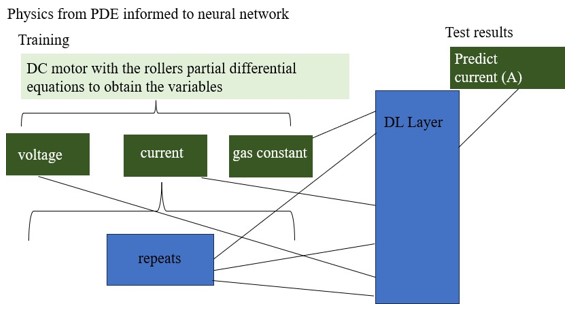
Figure 6: Schematic of Physics from Partial Differential Equations Informed in the Neural Network
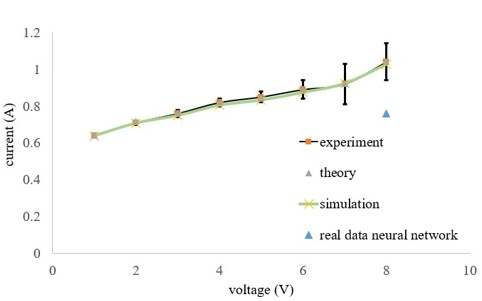
Figure 7: Comparison Between the Experiments, Theory and Simulations Current–Voltage Characteristics of the Motor. The Simulations Include Partial Differential Equations and Data Driven Neural Networks.
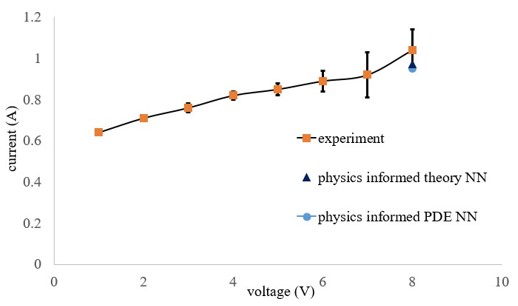
Figure 8: Comparison Between the Experiments and Neural Network Simulations of the Current– Voltage Characteristics. The Simulations Include the Physics from Theory Informed in the Neural Network and Partial Differential Equations and Data Driven Neural Networks. The Voltage of the Switched Mode Power Supply and Controller are Measured as 12.25 V in Our Experiments.
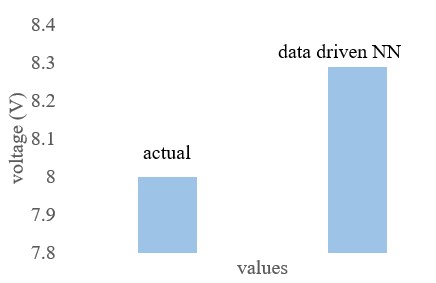
Figure 9: Comparison of the Voltage of the Motor Between Experiment and Data Driven Neural Network
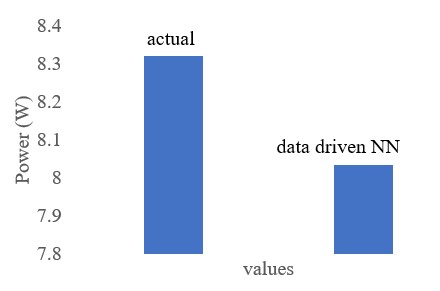
Figure 10: Power Obtained from the Experiments and Predict Results from Data Driven in the Neural Network.
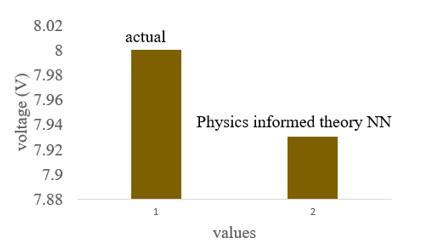
Figure 11: Comparison of the Voltage of the Motor Between Experiments and Physics Informed Theory in the Neural Network
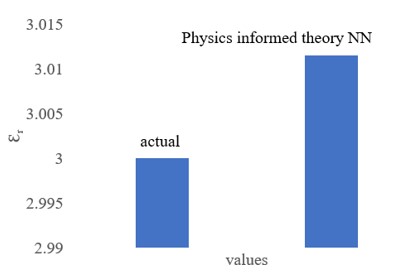
Figure 12: Relative Permittivity Prediction from Physics Informed Theory in the Neural Network
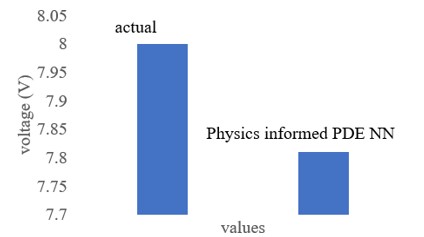
Figure 13: Comparison of the Voltage of the Motor Between Experiments and the Physics Informed Partial Differential Equation in the Neural Network
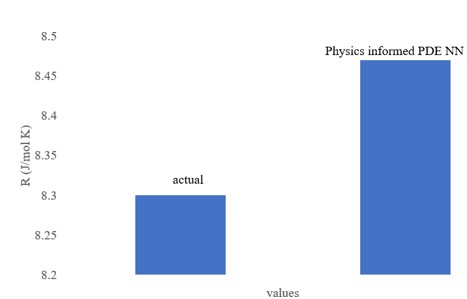
Figure 14: Gas Constant Prediction from Physics Informed Partial Differential Equation in the Neural Network
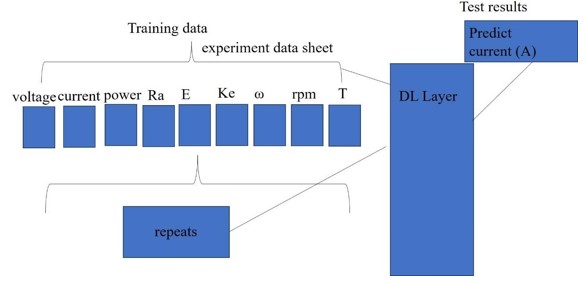
Figure 15: Schematic of Data Driven Neural Network for Parameters of the Device
Tables at a glance
Figures at a glance