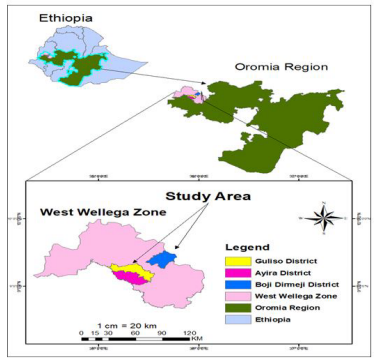
Figure 1: Study area map
Effect and Level |
AFS<br> (Months) |
AFC<br> LSM±SE<br> (Months) |
DO<br> LSM±SE<br> (Months) |
CI<br> LSM±SE<br> (Months) |
NSPC<br> LSM±SE |
District |
|||||
Ayira |
38.65ab±0.26 |
48.13ab±0.27 |
168.09b±3.08 |
15.09ab±0.1 |
2.1±0.07 |
Boji Dirmeji |
39.27a±0.26 |
48.76a±0.27 |
178.56a±3.08 |
15.38a±0.10 |
2.0±0.07 |
Guliso |
38.29b±0.26 |
47.77b±0.27 |
164.47b±3.08 |
14.95b±0.10 |
2.0±0.07 |
P value |
0.0254 |
0.0279 |
0.0031 |
0.0096 |
0.5671 |
Cow Breed |
|||||
Local |
45.38a±0.16 |
54.87a±0.18 |
197.11a±2.13 |
16.03a±0.07 |
2.1±0.05 |
Crossbred |
32.09b±0.26 |
41.56b±0.26 |
143.64b±3.03 |
14.25b±0.10 |
1.9±0.07 |
P value |
0.0001 |
0.0001 |
0.0001 |
0.0001 |
0.0577 |
Table 1: Least square means results of reproductive performance traits
a,b means on the same column with different superscripts for a given trait are significantly different (P< 0.05); ns = not significant; AFS = age at first service; AFC = age at first calving; DO = days open; CI = calving interval; NSPC = Number of services per conception.
Variable |
Year |
X2 |
P-Value |
||||
2019 |
2020 |
2021 |
2022 |
||||
Ayira |
Not conceived |
77 (11.72) |
78 (11.87) |
67 (10.20) |
60 (9.13) |
53.555 |
0.0001 |
Conceived |
33 (5.02) |
115 (17.5) |
74 (11.26) |
153 (23.29) |
|||
Boji |
Not conceived |
103 (8.76) |
104 (8.84) |
108 (9.18) |
100 (8.5) |
59.212 |
0.0001 |
Conceived |
108 (9.18) |
101 (8.59) |
290 (24.66) |
262 (22.28) |
|||
Guliso |
Not conceived |
123 (7.42) |
151 (9.11) |
168 (10.14) |
156 (9.41) |
56.996 |
0.0001 |
Conceived |
102 (6.16) |
351 (21.18) |
234 (14.12) |
372 (22.45) |
|||
Table 2: Conception status of inseminated cows
Singular values and inertia |
Column coordinates |
Partial Contribution |
||||||
SV |
Inertia |
X2 |
Per cent |
Attribute |
Dim 1 |
Dim 2 |
Dim 1 |
Dim 2 |
0.62184 |
0.38669 |
4098.2 |
19.33 |
Aira |
-0.582 |
-0.174 |
0.05504 |
0.00519 |
0.60415 |
0.36500 |
3868.4 |
18.25 |
Boji |
1.033 |
-0.264 |
0.31002 |
0.02144 |
0.58763 |
0.34531 |
3659.7 |
17.27 |
Guliso |
-0.502 |
0.256 |
0.10326 |
0.02846 |
0.57033 |
0.32528 |
3447.4 |
16.26 |
2019 |
0.696 |
1.072 |
0.06532 |
0.16404 |
0.54552 |
0.29760 |
3154.0 |
14.88 |
2020 |
-1.045 |
0.573 |
0.24287 |
0.07724 |
0.52926 |
0.28012 |
2968.8 |
14.01 |
2021 |
0.867 |
-0.154 |
0.17483 |
0.00585 |
|
|
|
|
2022 |
-0.232 |
-0.866 |
0.01460 |
0.21656 |
|
|
|
|
Conceived |
-0.094 |
-0.342 |
0.00620 |
0.08756 |
|
|
|
|
Not conceived |
0.421 |
1.539 |
0.02786 |
0.39367 |
Table 3: Principal inertias, percentages, column coordinates and partial contributions of conception status
SV = singular value; X2 = chi-square; Dim = dimension
Variable |
Year |
X2 |
P-Value |
||||
2019 |
2020 |
2021 |
2022 |
||||
Ayira |
HCB |
23 (6.13) |
82 (21.87) |
45 (12.0) |
103 (27.47) |
2.341 |
0.5046 |
Aborted |
10 (2.67) |
33 (8.8) |
29 (7.73) |
50 (13.33) |
|||
Boji |
HCB |
80 (10.51) |
81 (10.64) |
223 (29.3) |
230 (30.22) |
14.192 |
0.0027 |
Aborted |
28 (3.68) |
20 (2.63) |
67 (8.8) |
32 (4.2) |
|||
Guliso |
HCB |
68 (6.42) |
276 (26.06) |
177 (16.71) |
305 (28.8) |
11.925 |
0.0076 |
Aborted |
34 (3.21) |
75 (7.08) |
57 (5.38) |
67 (6.33) |
|||
Table 4: Delivery status (healthy calf born / aborted) of pregnant cows across study districts
HCB = healthy calf born
Singular values and inertia |
Column coordinates |
Partial contribution |
||||||
SV |
Inertia |
X2 |
Per cent |
Attribute |
Dim 1 |
Dim 2 |
Dim 1 |
Dim 2 |
0.63218 |
0.39965 |
3693.1 |
19.98 |
Aira |
-0.606 |
0.942 |
0.05588 |
0.15216 |
0.59551 |
0.35464 |
3277.2 |
17.73 |
Boji Dirmeji |
1.035 |
-0.274 |
0.28255 |
0.02233 |
0.58485 |
0.34205 |
3160.9 |
17.10 |
Guliso |
-0.432 |
-0.170 |
0.07814 |
0.01363 |
0.56913 |
0.32391 |
2993.2 |
16.20 |
2019 |
1.017 |
1.497 |
0.11584 |
0.28267 |
0.54909 |
0.30150 |
2786.1 |
15.07 |
2020 |
-0.881 |
0.692 |
0.15578 |
0.10843 |
0.52750 |
0.27826 |
2571.4 |
13.91 |
2021 |
0.640 |
-0.840 |
0.09669 |
0.18782 |
|
|
|
|
2022 |
-0.309 |
-0.380 |
0.02727 |
0.04628 |
|
|
|
|
Aborted |
1.237 |
1.161 |
0.16373 |
0.16271 |
|
|
|
|
HCB |
-0.182 |
-0.171 |
0.02411 |
0.02396 |
Table 5: Principal inertias, percentages, column coordinates and partial contributions
SV = singular value; X2 = chi-square; Dim = dimension; HCB = healthy calf born
Variable |
Year |
X2 |
P-Value |
||||
2019 |
2020 |
2021 |
2022 |
||||
Ayira |
Female |
12 (4.74) |
40 (15.81) |
23 (9.09) |
45 (17.79) |
1.090 |
0.7795 |
Male |
11 (4.35) |
42 (16.6) |
22 (8.69) |
58 (22.92) |
|||
Boji |
Female |
31 (5.04) |
43 (7.0) |
104 (16.94) |
123 (20.03) |
6.249 |
0.1001 |
Male |
49 (7.98) |
38 (6.19) |
119 (19.38) |
107 (17.43) |
|||
Guliso |
Female |
32 (3.87) |
128 (15.49) |
85 (10.29) |
151 (18.28) |
0.592 |
0.8982 |
Male |
36 (4.36) |
148 (17.92) |
92 (11.14) |
154 (18.64) |
|||
Table 6: Sex of calf born across study districts
Singular values and inertia |
Column coordinates |
Partial contribution |
||||||
SV |
Inertia |
X2 |
Per cent |
Attribute |
Dim 1 |
Dim 2 |
Dim 1 |
Dim 2 |
0.61927 |
0.38349 |
3075.0 |
19.17 |
Aira |
-0.675 |
1.163 |
0.07455 |
0.24224 |
0.59173 |
0.35015 |
2807.7 |
17.51 |
Boji |
1.130 |
0.00902 |
0.33618 |
2.35e-5 |
0.58797 |
0.34570 |
2772.0 |
17.29 |
Guliso |
-0.423 |
-0.435 |
0.07927 |
0.09174 |
0.56770 |
0.32229 |
2584.2 |
16.11 |
2019 |
0.722 |
1.828 |
0.05599 |
0.39252 |
0.56247 |
0.31637 |
2536.8 |
15.82 |
2020 |
-1.207 |
0.106 |
0.30698 |
0.00258 |
0.53104 |
0.28200 |
2261.2 |
14.10 |
2021 |
0.756 |
-0.558 |
0.14046 |
0.08372 |
|
|
|
|
2022 |
-0.029 |
-0.266 |
0.00026 |
0.02372 |
|
|
|
|
Female |
-0.089 |
-0.434 |
0.00330 |
0.08552 |
|
|
|
|
Male |
0.081 |
0.396 |
0.00301 |
0.07793 |
Table 7: Principal inertias, percentages, column coordinates and partial contributions of sex of calf born
SV = singular value; X2 = chi-square; Dim = dimension
Figure 1: Study area map
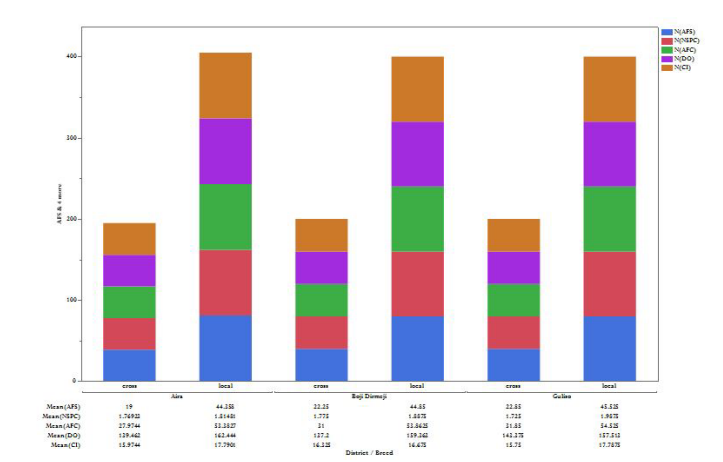
Figure 2: Stacked bar chart of the reproductive performance traits by breed and district
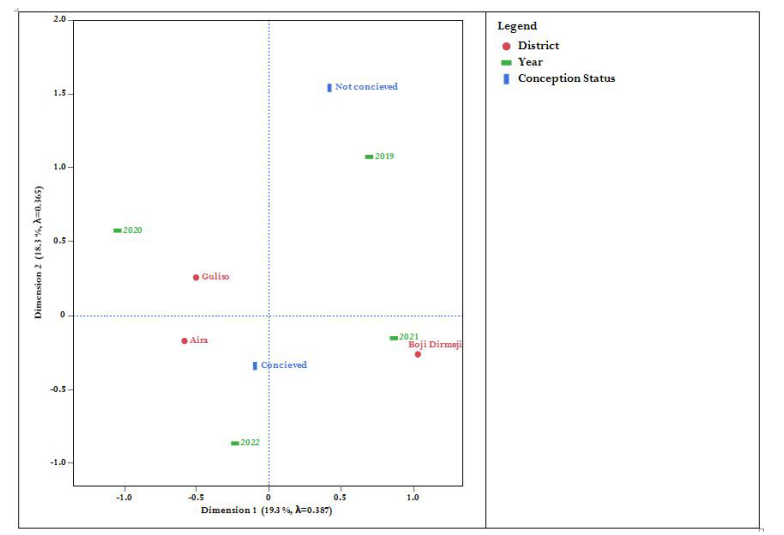
Figure 3: A bi-plot display of the conception status of inseminated cows
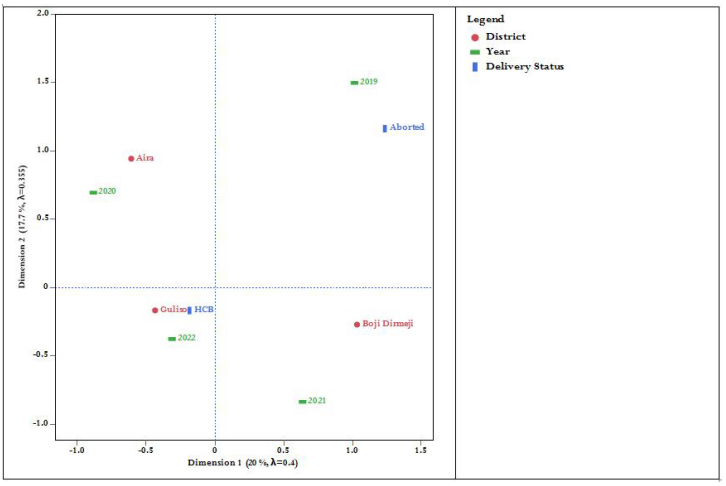
Figure 4: A bi-plot display for the delivery status of pregnant cow
Tables at a glance
Figures at a glance