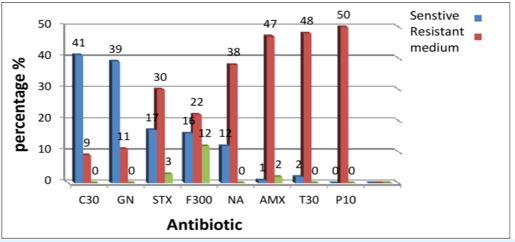
Figure 1: Antibiotic Sensitivity Test
Concentratio of extract(mg/ml) |
E.coli |
Staphylococcus aureus |
Streptococcus sp |
Klebsiella sp |
|
14.00 |
12.50 |
11.80 |
10.60 |
200 |
12.00 |
10.00 |
9.30 |
8.40 |
100 |
9.00 |
8.00 |
7.20 |
6.80 |
50 |
7.00 |
6.20 |
5.10 |
- |
|
21.00 |
17.00 |
14.50 |
12.80 |
Table 2: Mean diameter zones of inhibition of ethanol leaf extracts against the tested organisms (mm)
Extaracts |
E.coli |
Staphylococcus aureus |
Streptococcus sp |
Klebsiella sp |
|
50 |
50 |
100 |
100 |
|
100 |
100 |
200 |
200 |
Table 3: Minimum inhibitory concentration (MIC) of the test extracts (mg/ml)
|
T. WBC SX103 |
NEX103 |
Lyx103 |
MOX103 |
EOX103 |
After zero time from infection A |
4.60 |
3.05 |
1.17 |
0.37 |
0.00 |
B |
4.30 |
2.79 |
1.07 |
0.34 |
0.00 |
AB |
4.50 |
3.05 |
1.17 |
0.37 |
0.00 |
After 5 days from infection A |
4.60 |
3.05 |
1.17 |
0.37 |
0.00 |
B |
9.70 |
7.96 |
1.02 |
0.72 |
0.00 |
AB |
11.30 |
10.05 |
1.18 |
0.10 |
0.00 |
After 8 days from infection A |
4.60 |
3.05 |
1.17 |
0.37 |
0.00 |
B |
14.40 |
7.13 |
0.61 |
0.69 |
0.00 |
AB |
9.50 |
7.96 |
1.02 |
0.72 |
0.00 |
After 12 days from infection A |
4.60 |
3.05 |
1.17 |
0.37 |
0.00 |
B |
16.30 |
13.84 |
1.32 |
0.94 |
0.00 |
AB |
7.30 |
6.31 |
0.09 |
0.58 |
0.00 |
After 16 days from infection A |
4.60 |
3.05 |
1.17 |
0.37 |
0.00 |
B |
13.60 |
11.85 |
1.63 |
0.21 |
0.00 |
AB |
5.10 |
5.58 |
0.98 |
0.51 |
0.00 |
A = Control; B = Infected mice with E.coli; AB = Infected mice with E.coli and treated with plant extract; TWBCs = total white blood cells; Ne= Neutrophil; Ly = Lymphosite; Mo= Monosite Eo = Eosinophil
Table 4: The effect of Solanum aethiopicum leaf extract on E.coli in vivo
Figure 1: Antibiotic Sensitivity Test
Tables at a glance
Figures at a glance