Genotypic frequencies
Allelic frequencies
Hardy-Weinberg equilibrium
Breeds
N
AA
AB
BB
A
B
χ2 probability
Kurdish
171
0.977
0.017
0.006
0.985
0.015
0*
Iranian Arab
21
0.952
0.048
0
0.023
1
Turkemin
15
0.8
0.2
0. 2
Unknown
12
0.917
0.083
Table 1: Distribution of BamHI genotypic and allelic frequencies in Iranian breeds of horses
Diversity parameter
Population
Ho
He
Ne
PIC
F IS
0.0175
0.0289
1.03
0.03
0.3911
0.0476
1.05
0.04
-0.0244
0.3310
1.47
0.32
0.1594
1.18
0.15
Table 2: Genetic diversity at the cytochrome b gene in Iranian breeds of horses
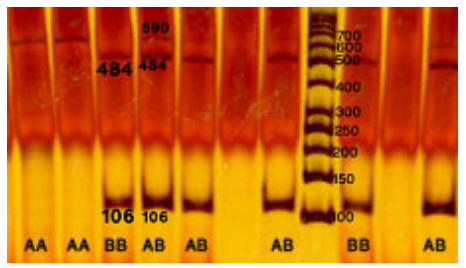
Figure 1: Cleavage patterns by BamHI of amplified mtDNA fragments in horse
Tables at a glance
Figures at a glance