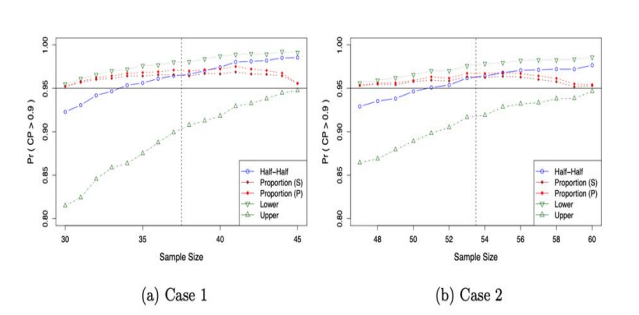
Figure 1: Determination of Nonparametric Lower Tolerance Limits when the Underlying Distribution is N(1,2): True Probability of Coverage Probability greater than 0.9 depending on Sample Size
Figure 1: Determination of Nonparametric Lower Tolerance Limits when the Underlying Distribution is N(1,2): True Probability of Coverage Probability greater than 0.9 depending on Sample Size
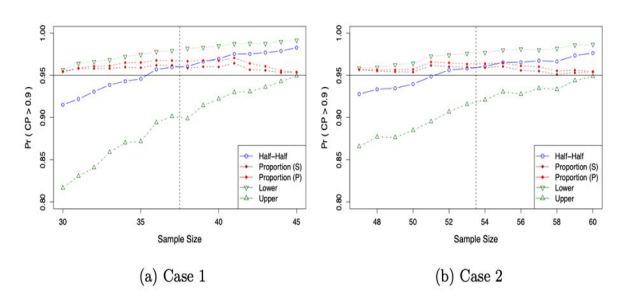
Figure 2: Determination of Nonparametric Lower Tolerance Limits when the Underlying Distribution is Exp(0.7): True Probability of Coverage Probability greater than 0.9 depending on Sample Size
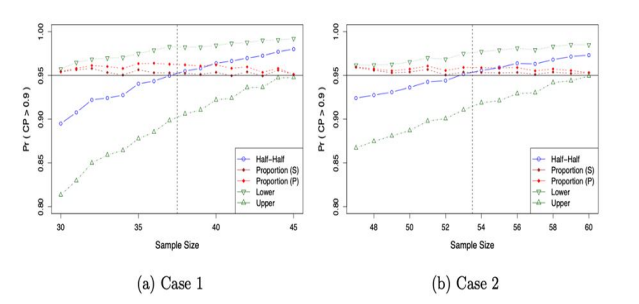
Figure 3: Determination of Nonparametric Lower Tolerance Limits when the Underlying Distribution is chi-square (1): True Probability of Coverage Probability greater than 0.9 depending on Sample Size
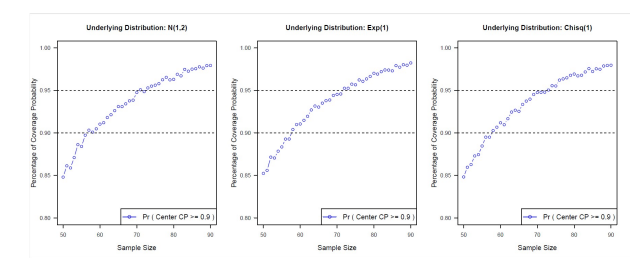
Figure 4: Simulation results for the (P,1-a) nonparametric two one-sided tolerance interval (X(k),X(N-k+1)) when k = 1, a = 0.05. The figure below presented the center coverage of the tolerance interval for different sample size N under three types of underlying distributions. The minimum sample size requirement to obtain a center coverage greater than 0.9 is consistent with the results in Table 1 with k = 1 and P = 0.9.
Tables at a glance
Figures at a glance