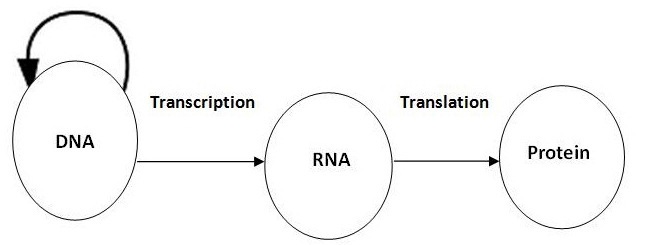
Figure 1 Central Dogma
Figure 1 Central Dogma
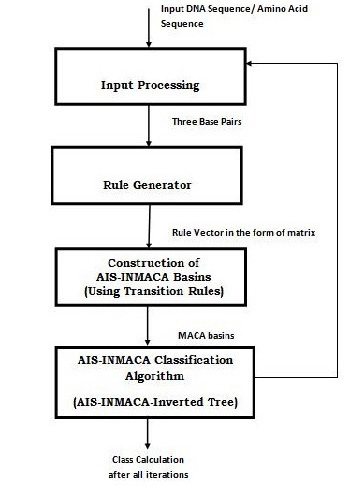
Figure 2 Design of AIS-INMACA

Figure 3Interface
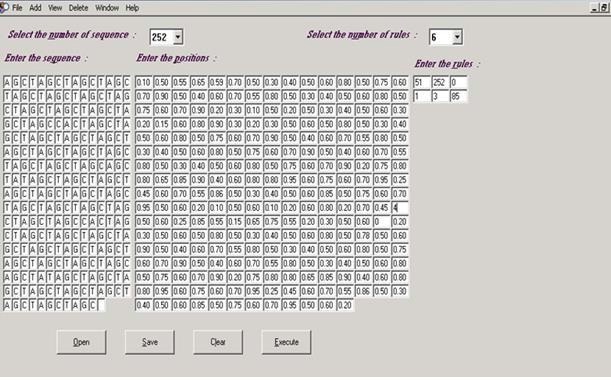
Figure 4Training Interface
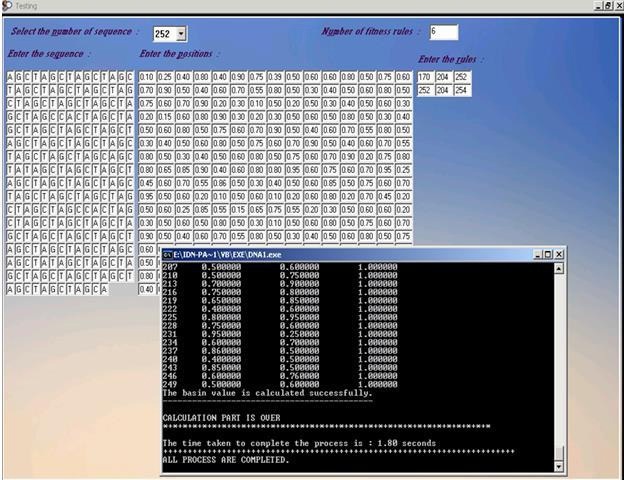
Figure 5 Testing Interface
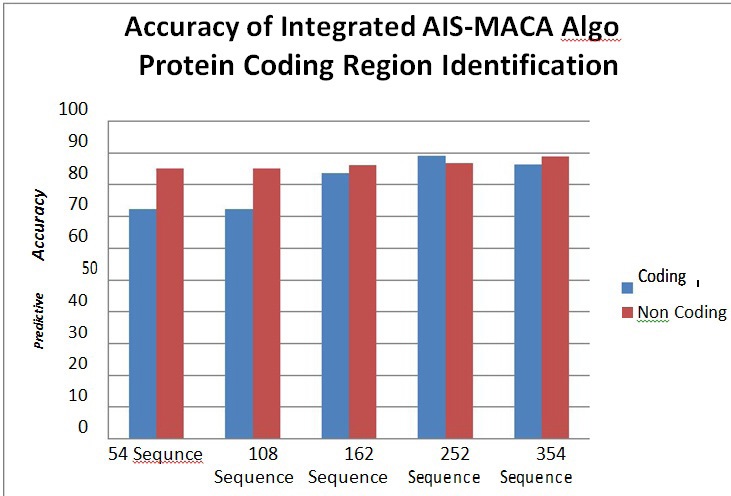
Figure 6 Predictive Accuracy for Protein Coding Regions
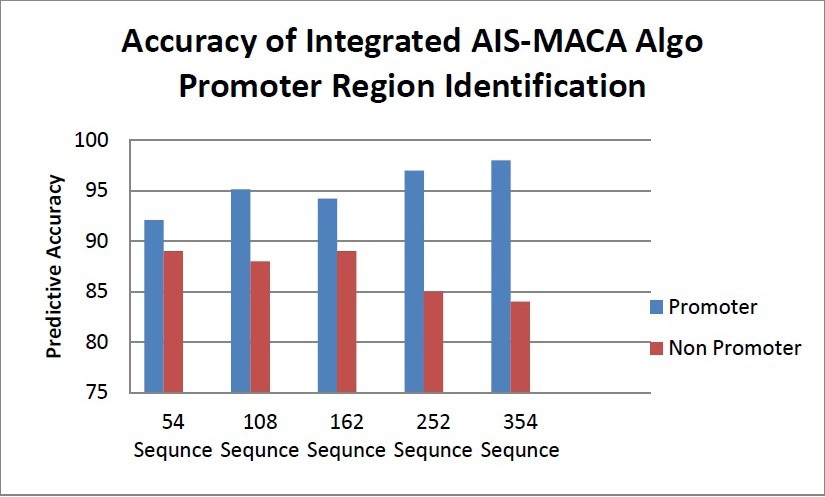
Figure 7 Predictive Accuracy for Promoter Regions
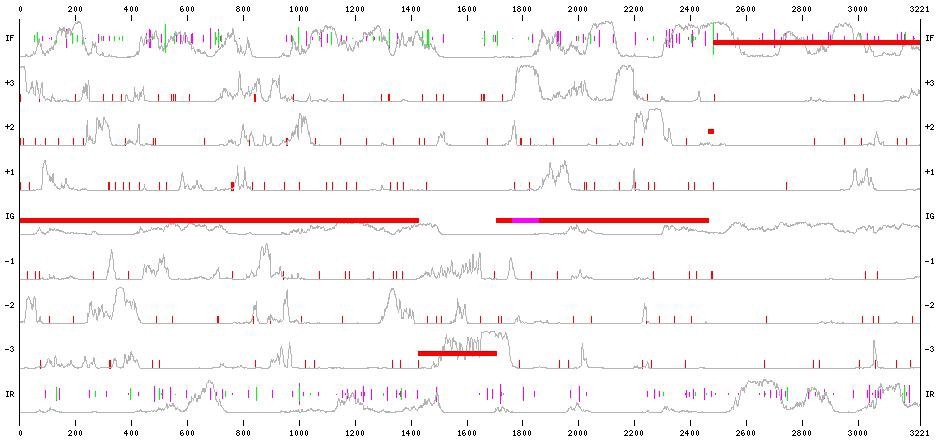
Figure 8 Exons Prediction
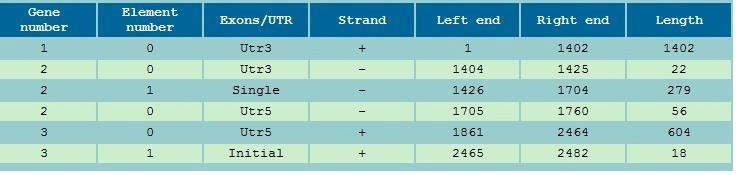
Figure 9 Exons Boundaries Reporting
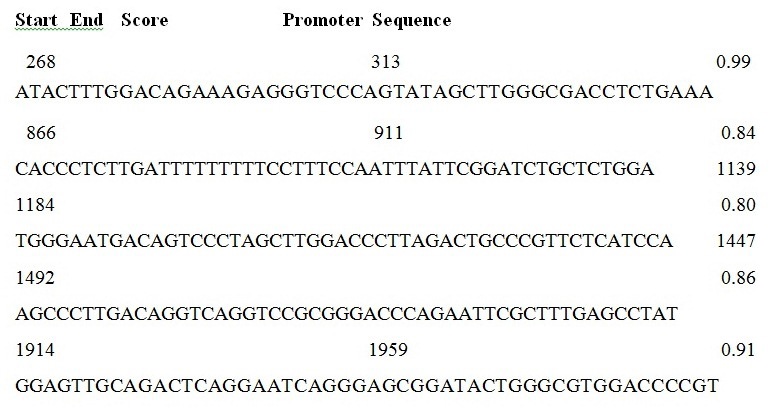
Figure 10 Predictive Accuracy for Promoter Regions
Neighbourhood |
111 |
|
110 |
101 |
|
100 |
011 |
010 |
001 |
000 |
Rule |
||
|
|
|
|
|
|
|
|
|
|
|
|
|
|
Next State |
0 |
|
|
0 |
|
1 |
|
1 |
0 |
0 |
1 |
1 |
51 |
( Rule 51) |
|
|
|
|
|
|
|
|
|
|
|
|
|
Next State |
1 |
|
|
1 |
|
1 |
|
1 |
1 |
1 |
1 |
0 |
254 |
(Rule 254) |
|
|
|
|
|
|
|
|
|
|
|
|
|
Table 1:Transition Function
SNO |
Rule Number |
General Representation |
1. |
1 |
q i-1 +qi + qi+1 |
2. |
3 |
q i-1 +qi |
3. |
17 |
qi + qi+1 |
4. |
5 |
q i-1 + qi+1 |
5. |
51 |
qi |
6. |
15 |
q i-1 |
7. |
85 |
qi+1 |
8. |
255 |
1 |
Table 2:Complemented Rules
SNO |
Rule Number |
General Representation |
1. |
254 |
q i-1 +qi + qi+1 |
2. |
252 |
q i-1 +qi |
3. |
238 |
qi + qi+1 |
4. |
250 |
q i-1 + qi+1 |
5. |
204 |
qi |
6. |
240 |
q i-1 |
7. |
170 |
qi+1 |
8. |
0 |
0 |
Table 3:Non complemented Rules
Size of Data Set |
Prediction Time of Integrated |
|
Algorithm |
5000 |
1064 |
6000 |
1389 |
10000 |
2002 |
20000 |
2545 |
Table 4:Execution Time for prediction of both protein and promoter regions.
Data Set |
54 |
108 |
162 |
252 |
354 |
TrainingSet Coding |
21,203 |
7,452 |
3,520 |
2,201 |
1,003 |
TrainingSet |
22,563 |
35,256 |
2,560 |
2,056 |
506 |
Testing Set Coding |
22,569 |
21,023 |
16,564 |
3,002 |
689 |
Testing Set Non Coding |
32,562 |
28,568 |
12,056 |
2,006 |
700 |
Table 5:Number of Data Sets Used