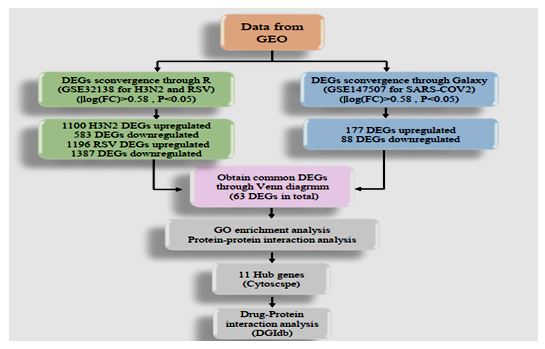
Figure 1: Flowchart of data preparation, processing, and analysis in this study
Figure 1: Flowchart of data preparation, processing, and analysis in this study
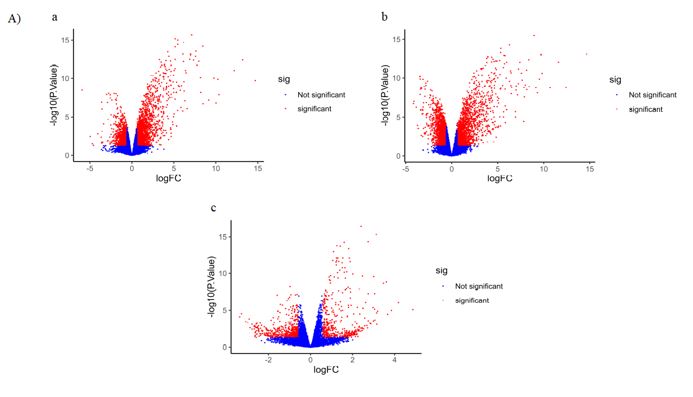
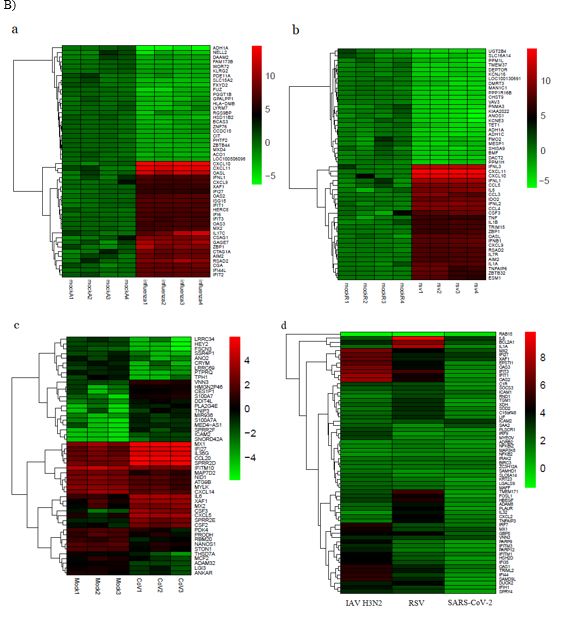
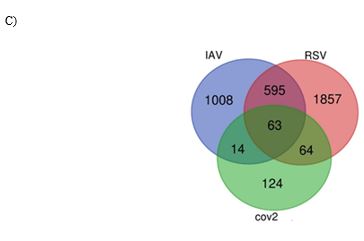
Figure 2: A) The volcano plots presenting DEGs for IAV H3N2 (a), RSV (b), and SARS-CoV-2 (c). The y-axis demonstrates the log10 values of the p-values for the significance of each examined DEG, while the x-axis shows the log10 values of fold changes for each DEG. Red plots depict DEGs with logFCs =0.58 or =-0.58, and blue plots displays remained DEGs with no statistical significance. B) Venn diagram of overlapping DEGs for three viruses. C) The heatmap of 50 top DEGs (25 increased and 25 decreased) in IVA H3N2 (a), RSV (b), SARS-CoV-2 (c), and 63 common DEGs (d). Red and green colors reflected upregulation and downregulation, respectively
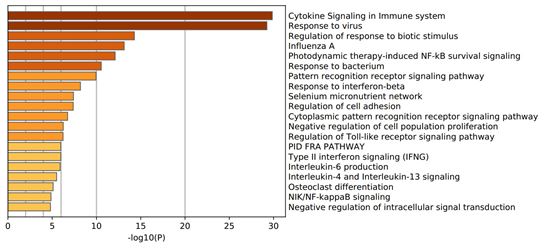
Figure 3: Gene Ontology (GO) enrichment analysis of the common differentially expressed genes
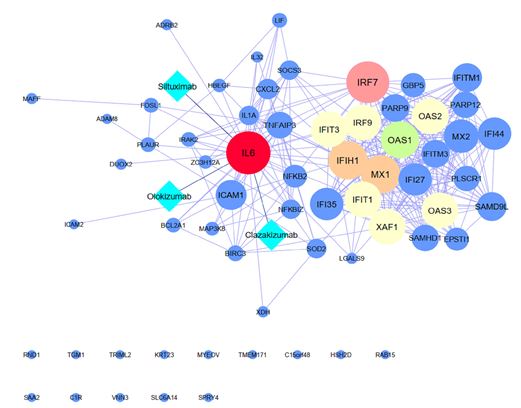
Figure 4: Protein-protein interactions network construction and Drug prediction with p-value <1.0e-16
Tables at a glance
Figures at a glance