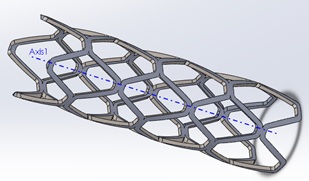
Figure 1 3D model of 8-sturt structure stent with 4 rhombus cross-sectional units
Figure 1 3D model of 8-sturt structure stent with 4 rhombus cross-sectional units
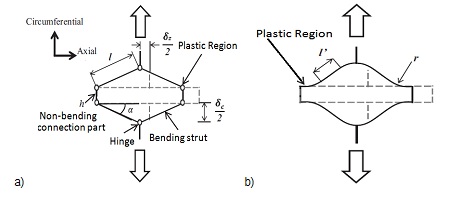
Figure 2 Nonlinear analysis approach for stent with rhombus structure considering the connection part of model a) idealized analytical model in non-linear analyses b) part curvature of plasticity region due to the expansion forces [16].
Figure 3 Non-uniform artery geometry [1]
Figure 4 3D artery model with blood flow developed from IVUS image
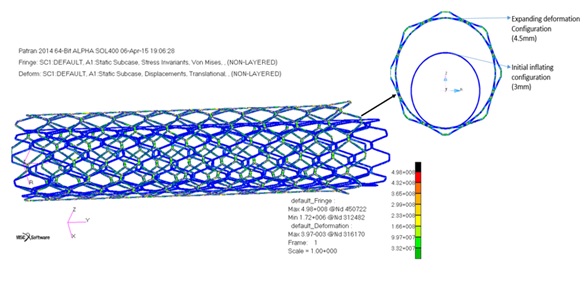
Figure 5 Stress distribution of inflated stent under pressure from 3mm (blue configuration) to 4.5 mm (green configuration)
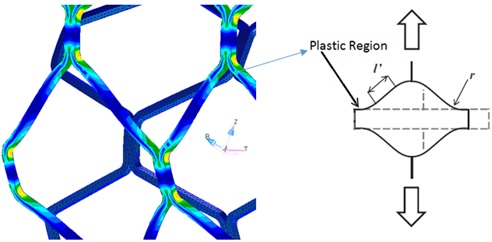
Figure 6Stent configuration after inflation showing the plastic regions with the maximum equivalent stress presented with yellow/green colors and aligns with the theoretical model
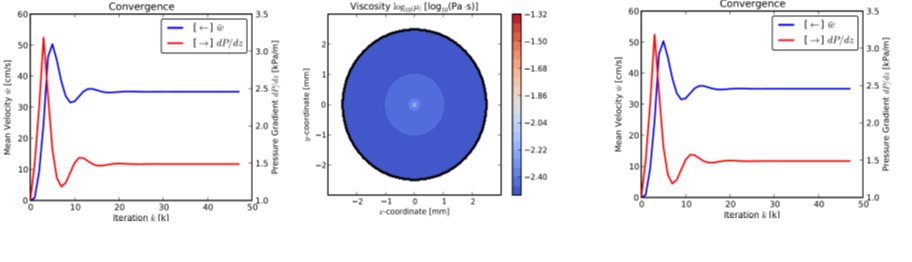
Figure 7 a) Velocity distribution of the blood flow in artery cross-section b) viscosity distribution of the blood flow in artery cross-section c) Comparison of the mean velocity and pressure gradient over several iterations
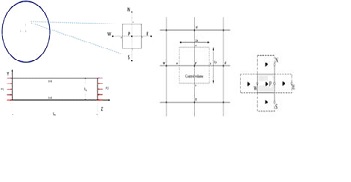
Figure 8 a) Segment of blood model field (cross-section of the artery) as the control volume of studied flow. b) finite volume cell with neighbor points in the control volume.
Property |
Value |
Young’s modulus |
190GPa |
Poisson ratio |
0.3 |
Yield stress |
207MPa |
Ultimate stress |
515MPa |
Limit nominal strain |
60% |
Table 1. Materials properties of 316L SS stents
Parameter |
Calculated Value |
Power law index in Carreau model (n) |
0.344 |
Zero shear rate limit (μ_0) |
0.0456Pa |
Infinite shear rate limit(μ_∞) |
0.0032 Pa |
Relaxation time constant(λ) |
10.03s |
Ideal mean velocity of blood |
0.35 m/s |
Table 2. Parametric values for the non-Newtonian constitute equations