Figure 1 Schematic of prosthetic pylon design [4]
Figure 1 Schematic of prosthetic pylon design [4]
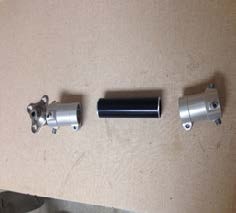
Figure 2 Most common commercial prosthetic pylon design. Courtesy of Excell Orthotics and Prosthetics in Denton Texas.
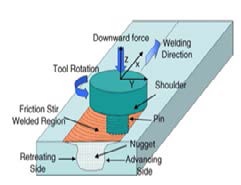
Figure 3 Schematic of Friction Stir Process [7]
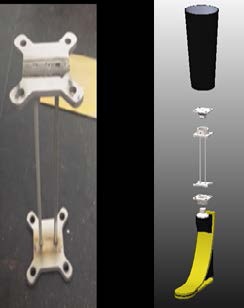
Figure 4 Image showing the proposed pylon design b) CAD model showing proposed pylon design fully integrated into the prosthesis system
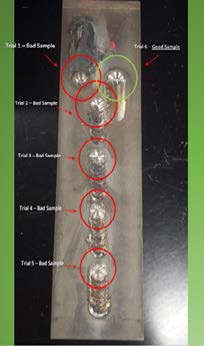
Figure 5 Trial FSP of Ti 6246 plate in order to determine optimal processing parameters
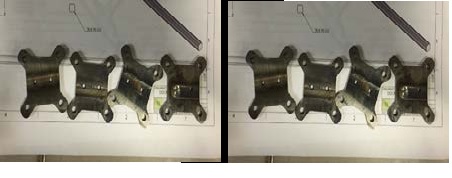
Figure 6CAD model showing the four plates for the proposed pylon design b) image showing four plates cut on the water-jet
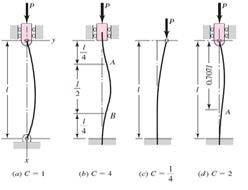
Figure 7 Euler Column Buckling: End Conditions Constant Schematic [13]
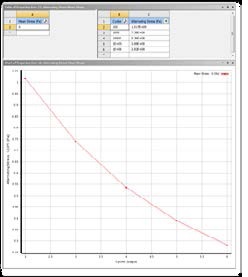
Figure 8 Alternating stress vs. cycled data imported into ANSYS Workbench
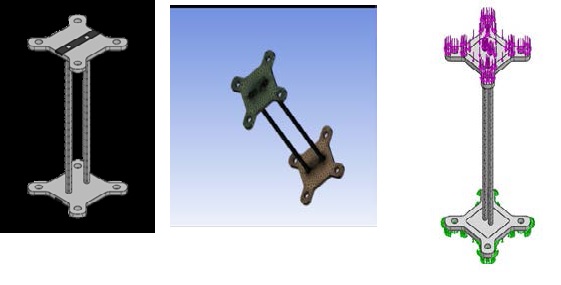
Figure 9 a) ANSYS 3D model of the proposed pylon b) Meshed model in ANSYS c) Boundary conditions imposed on the pylon design for modeling analysis
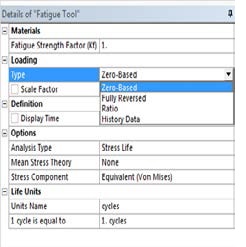
Figure 10 Loading options under Fatigue tool in ANSYS Structural Modeler.
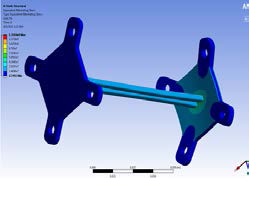
Figure 11 Stress distribution in proposed pylon model simulated in ANSYS
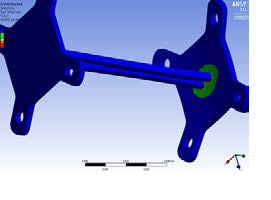
Figure 12 Factor of Safety distribution in the pylon model simulated in ANSYS at 550lbs load
Figure 13 Euler Buckling Analysis for each slender bar in the proposed pylon design
Material |
Mass (g) |
Yield Strength (MPa) |
Ultimate Strength (MPa) |
Al 1060 |
84.99 |
27.57 |
68.94 |
Al 6061 |
84.83 |
55.15 |
124.08 |
Al7075-O |
88.29 |
95 |
220 |
Ti6Al-2Sn-4Zr-6Mo (0.75 mm Thickness) |
46.27 |
1048 |
1185.9 |
Ti6Al-2Sn-4Zr-6Mo (with FSP-0.75 mm Thickness) |
31.08 |
1738 |
2020 |
Table 1 Summary of properties of materials for pylon applications
Product |
Material |
Length |
Weight at 127mm (g) |
Proposed Design |
Titanium |
127 |
0.057 |
A-500 XHD [10] |
Carbon Fiber |
304.8 |
0.098 – 41.8% difference from prop. design |
5209C [11] |
Carbon |
304.8 |
0.112 – 49% difference from prop. design |
Table 2 Summary of different pylon characteristics
Trial # |
Spinning speed (rpm) |
Travel speed (in/min) |
Environment |
5, 4 & 3 |
600 |
1 |
Air |
1, 2 |
1000 |
1 |
Air |
6 |
1000 |
1 |
Argon |
Table 3 Summary of processing parameters for each trial in Figure 5
Load |
Pressure |
Euler Alternating Stresses |
Safety Factor |
|||
Lbs |
N |
Pa |
Psi |
Min |
Max |
Min |
600 |
2669 |
291,192 |
42.2 |
19.6 |
1.4 e8 |
1.96 |
550 |
2447 |
266,926 |
38.7 |
17.9 |
1.3 e8 |
2.14 |
500 |
2224 |
242,660 |
35.2 |
16.4 |
1.2 e8 |
2.35 |
450 |
2002 |
218,394 |
31.7 |
14.7 |
1.1 e8 |
2.61 |
400 |
1779 |
194,128 |
28.2 |
13.1 |
9.6 e7 |
2.94 |
350 |
1557 |
169,862 |
24.6 |
11.5 |
8.4 e7 |
3.36 |
300 |
1334 |
145,596 |
21.1 |
9.8 |
7.2 e7 |
3.92 |
250 |
1246 |
121,330 |
17.6 |
8.2 |
5.9 e7 |
4.71 |
Table 4 Summary of Fatigue Analysis