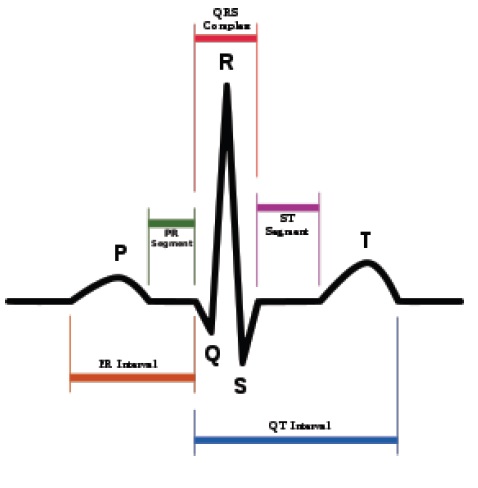
Figure 1 An ECG signal with typical time intervals
Figure 1 An ECG signal with typical time intervals
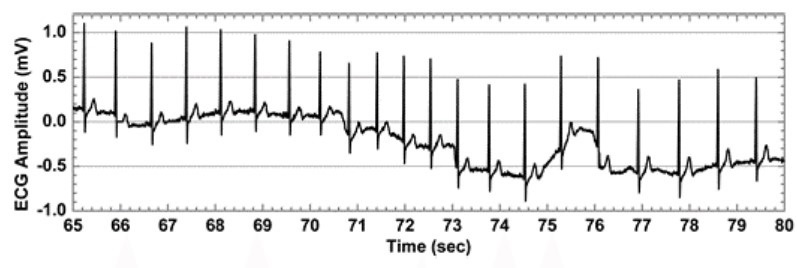
Figure 2 An ECG Signal with baseline wander (drift) [1]
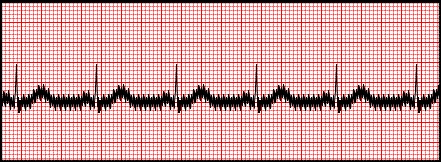
Figure 3 ECG affected by powerline (50/ 60 Hz) interference [2]
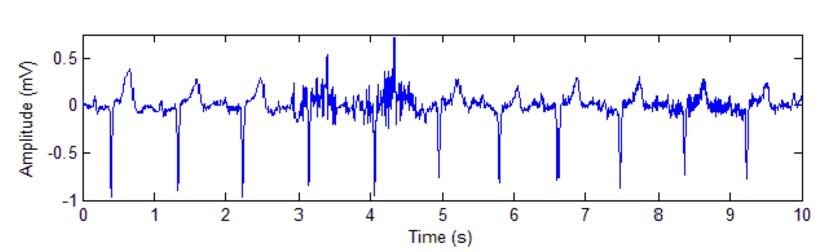
Figure 4 ECG signal with electromyographic (EMG) noise
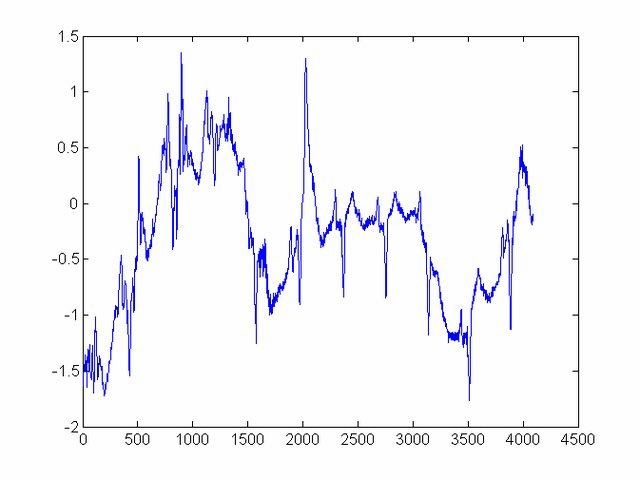
Figure 5 ECG affected by electrode motion artifacts [2]
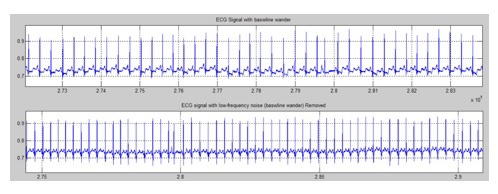
Figure 6 ECG signal with baseline wander (above); ECG signal with baseline wander removed (below) using high-pass filter.
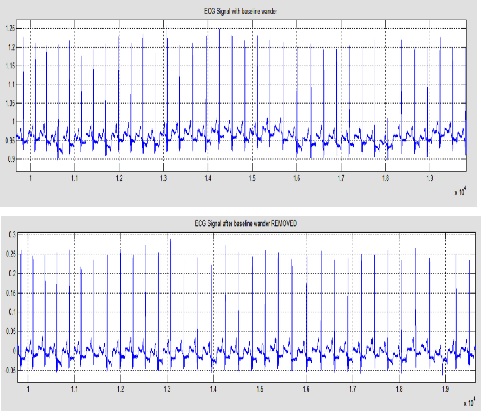
Figure 7 ECG signal with baseline wander (above); ECG signal with baseline wander removed (below) using DWT.
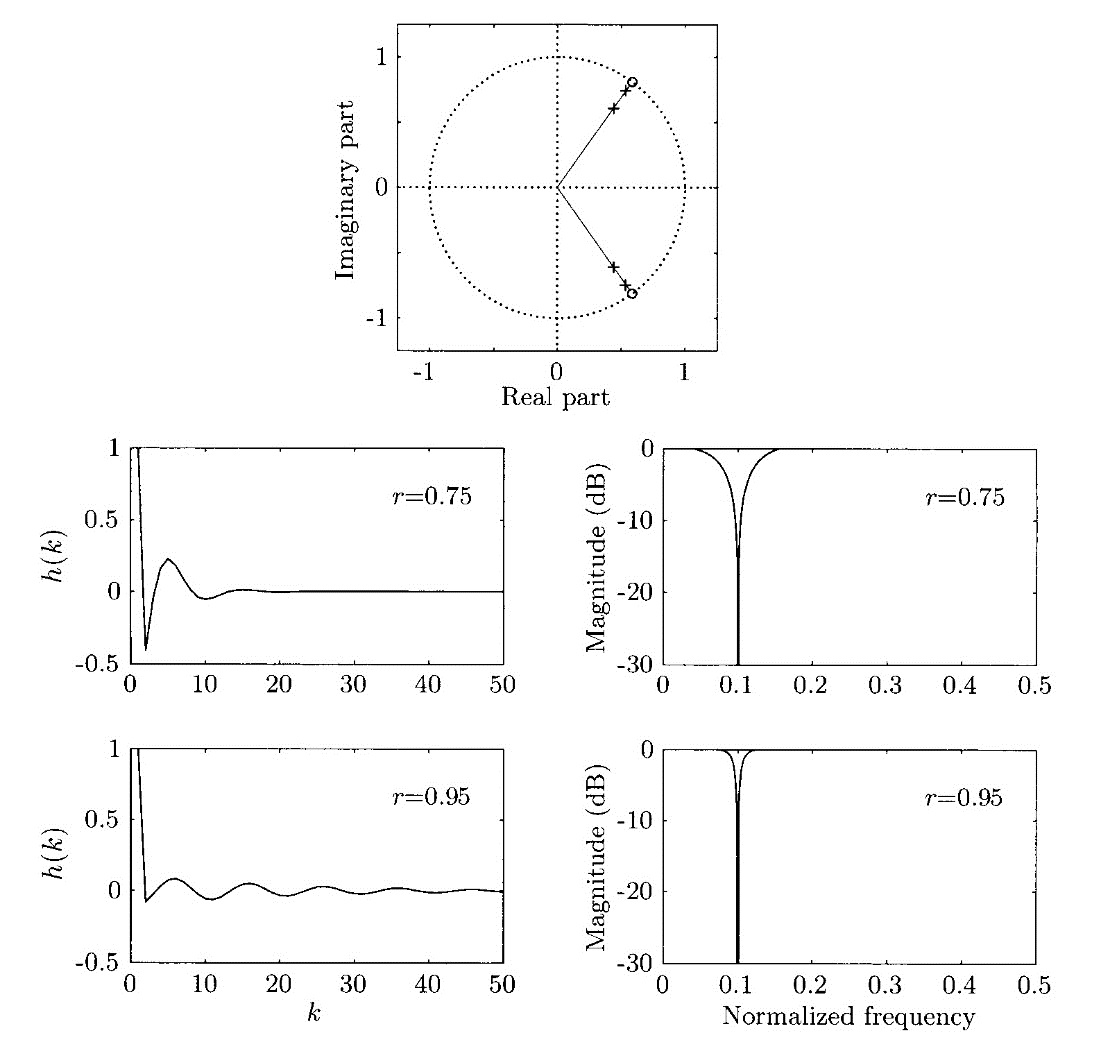
Figure 8 Pole-zero diagram for two second-order IIR filters whose zeros are identically positioned but whose poles are at a radius r of either 0.75 or 0.95. The impulse response h (k) and the corresponding magnitude function are shown in the left and right panels, respectively [4].
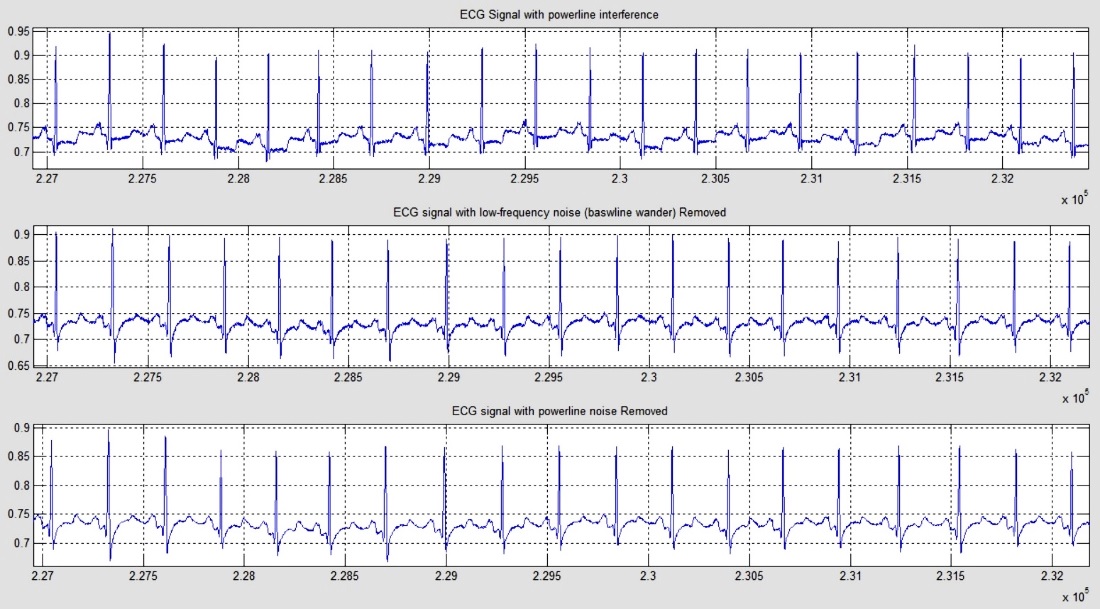
Figure 9Original ECG signal containing both baseline wander and powerline interference (top); ECG signal with baseline wander removed (middle); ECG signal with powerline interference removed (bottom)
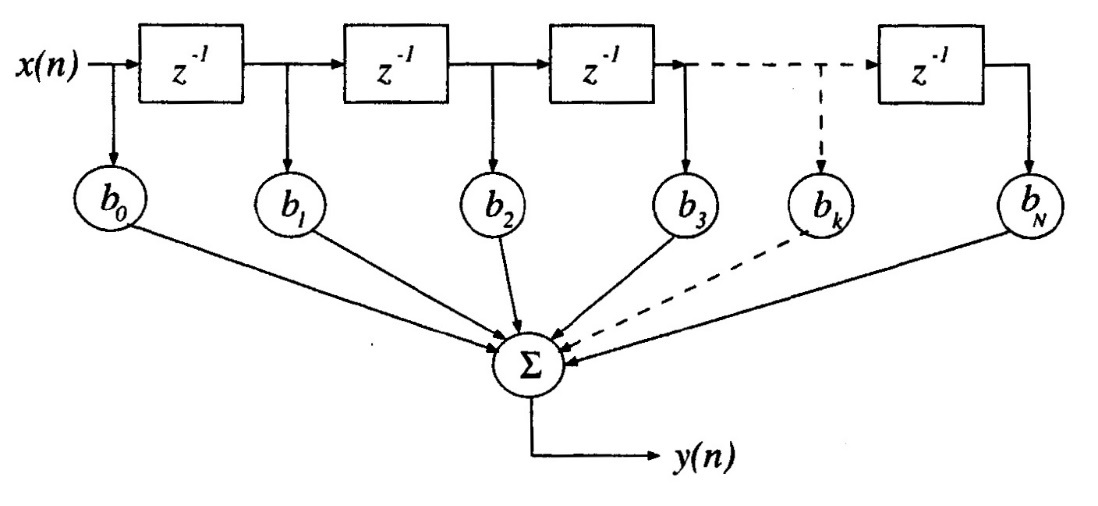
Figure 10 Signal-flow diagram of a moving-average filter of order N. Each block with the symbol 1z− represents a delay of one sample, and serves as a memory unit for the corresponding signal sample value [5].
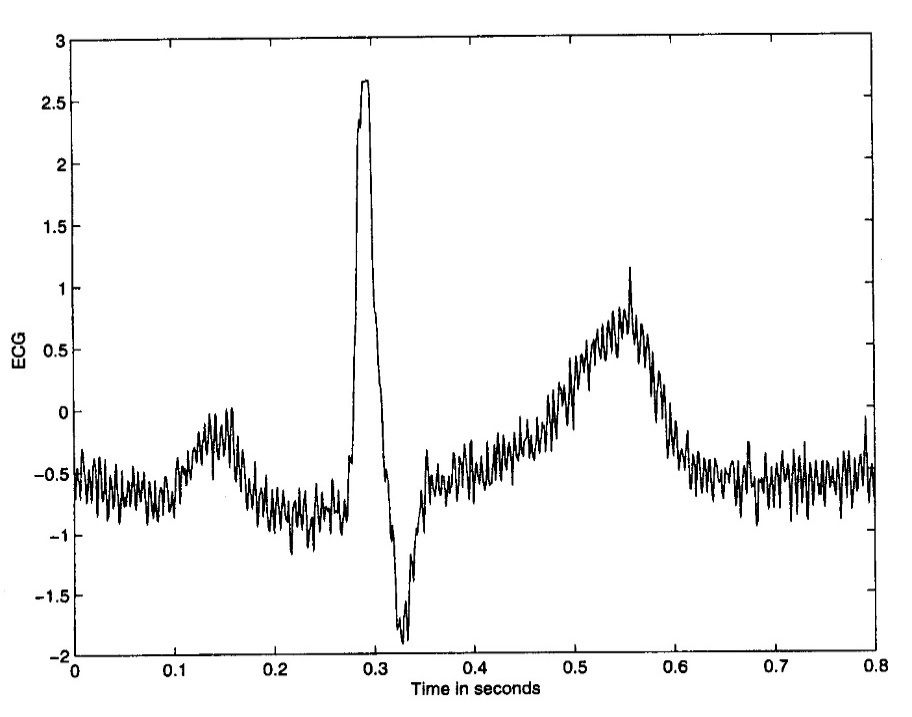
Figure 11 ECG signal with high-frequency (EMG like) noise; fs = 1,000 Hz [5]
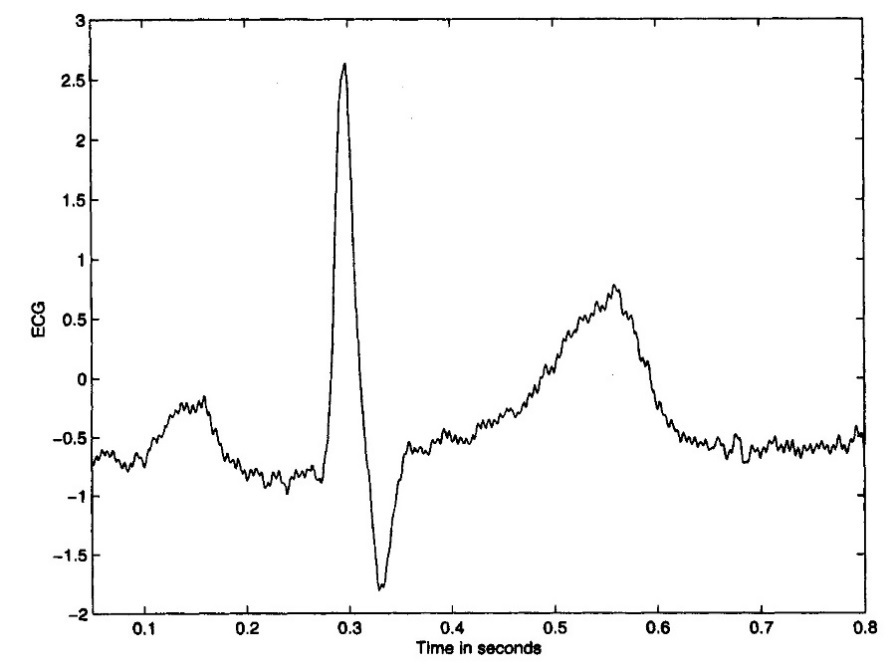
Figure 12 The ECG signal with high-frequency (EMG like) noise in (Figure 11) after filtering by the 8-point MA filter [5]
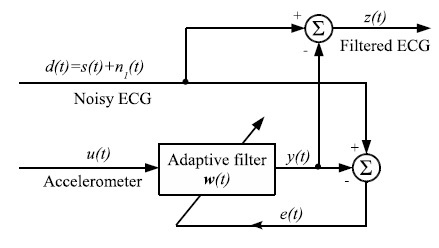
Figure 13 Block diagram of adaptive filtering scheme [10]
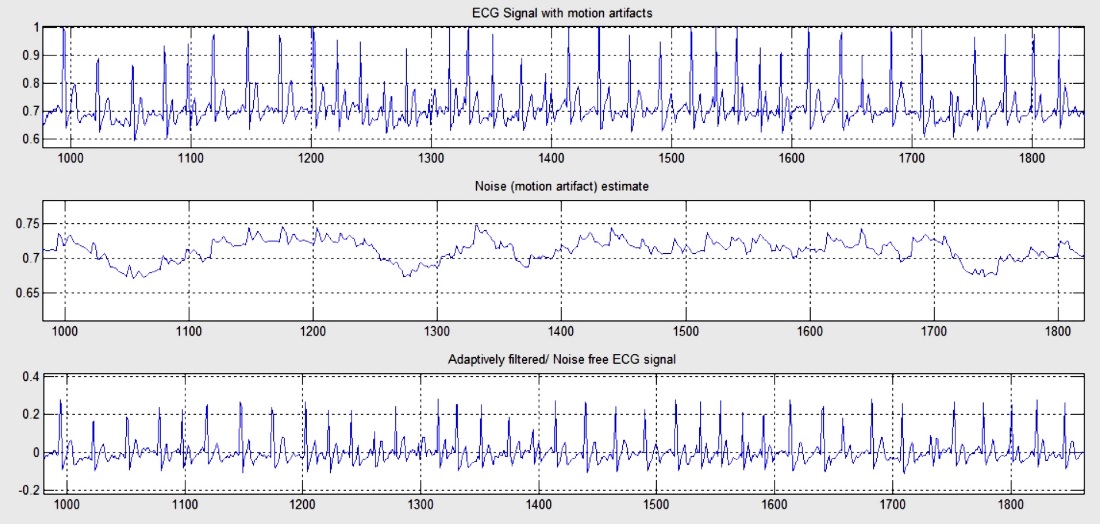
Figure 14 Removal of motion artifacts from ECG using adaptive filtering. (top) ECG signal with motion artifacts, (middle) noise/ motion artifact, (bottom) noise-free ECG signal