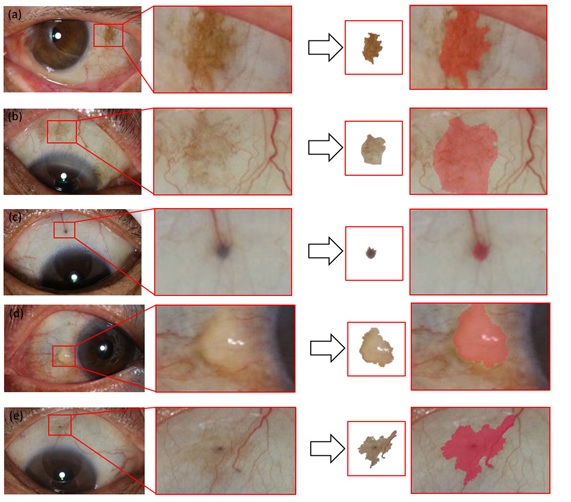
Eye feature |
Yellow Area |
Gray Speck |
Spot |
Hillock |
Moon Halo |
Number |
113 |
10 |
41 |
70 |
7 |
Ratio(%) |
89.0 |
7.8 |
32.8 |
55.1 |
5.4 |
Table 1. Statistical Data of Eye Feature Classification of127 Diabetics.
Eye feature |
Yellow Area |
Gray Speck |
Spot |
Hillock |
Moon Halo |
Number |
13 |
4 |
9 |
3 |
4 |
Ratio(%) |
26.0 |
8.0 |
45.0 |
6.0 |
8.0 |
Table 2. Statistical Data of Eye Feature Classification of general Controls.
ID |
Clinical |
AI system |
ID |
Clinical |
AI system |
ID |
Clinical |
AI system |
1 |
P |
N |
19 |
P |
P |
37 |
P |
P |
2 |
P |
P |
20 |
P |
P |
38 |
P |
P |
3 |
P |
P |
21 |
P |
N |
39 |
N |
N |
4 |
P |
P |
22 |
P |
P |
40 |
N |
N |
5 |
P |
P |
23 |
P |
P |
41 |
N |
N |
6 |
P |
P |
24 |
P |
P |
42 |
N |
N |
7 |
P |
P |
25 |
P |
P |
43 |
N |
N |
8 |
P |
P |
26 |
P |
N |
44 |
N |
N |
9 |
P |
N |
27 |
P |
P |
45 |
N |
N |
10 |
P |
P |
28 |
P |
P |
46 |
N |
N |
11 |
P |
P |
29 |
P |
P |
47 |
N |
N |
12 |
P |
P |
30 |
P |
N |
48 |
N |
N |
13 |
P |
P |
31 |
P |
P |
49 |
N |
P |
14 |
P |
N |
32 |
P |
P |
50 |
N |
N |
15 |
P |
P |
33 |
P |
P |
51 |
N |
P |
16 |
P |
P |
34 |
P |
P |
52 |
N |
N |
17 |
P |
P |
35 |
P |
P |
53 |
N |
N |
18 |
P |
P |
36 |
P |
P |
|
|
|
Table 3. Statistical data from the AI system diagnostic results of 38 diabetics and 15 general controls.
|
Normal type |
Serious type |
Moderate type |
Normal value |
TRIG(mmol/L) |
1.57 |
1.97 |
1.77 |
<1.70 |
LDL(mmol/L) |
3.19 |
3.64 |
3.43 |
<3.12 |
TCHO(mmol/L) |
5.64 |
6.10 |
5.89 |
<5.72 |
Table 4. The average concentration of TRIG, LDL, and TCHO in different types of patients.
Patients type |
N type |
M type |
P type |
Proportion of patients whose TCHO was > 6.00mmol/L |
20.0% |
40.7% |
60.7% |
Table 5.The proportion of patients witha dangerous level of TCHO.