Physical Study of D-Glucose and Glucose -2DG Based on Density Function Theory
Received Date: November 28, 2021 Accepted Date: December 28, 2021 Published Date: December 30, 2021
doi: 10.17303/jber.2021.5.103
Citation: Nirbhay Kumar Singh (2021) Physical Study of D-Glucose and Glucose -2DG Based on Density Function Theory. J Biomed Eng Res 1: 1-11.
Abstract
The density function theory (DFT) employing SIESTA were used in order to predict the structural and electronic properties of D-glucose and glucose- 2DG. Such compounds, in their solid form, are widely used in chemical and pharmaceutical industry. Despite the fact that the two compounds have the same space group, 2DG has the 2-hydroxyl group replaced by two hydrogen from D-glucose so that it cannot undergo further glycolysis. The objective of this paper is to analyze the physical propeerties of D-glucose and glucose 2DG with their structural–activity by mapping electrostatic potential (MEP) surface, types of bond formation among the atoms by charge density analysis, countribution of velence shell lectrons in total enery states and change in reactivity due to their phase change from D-glucose to glucose-2DG etc. Appreciable change is observed in structural, electronics properties, physical behaviours, bond length. bond angle and change in forbidden energy gap during their phase changes.
Keywords: Electrostatics Potential Surface; Projected Density of States and Density of States
Introduction
D-glucose is most abundant monosaccharides which made by plants by the process of photosynthesis from water and carbondioxide, it is primary source of energy for living organisms and prepared by plants duirng photo synthesis and their molecular formula is C6H12O5 [1] as shown in Figure 1(a), while 2-Deoxy-D-glucose abbribated as 2DG is a glucose molecule with the molecular formula C6H12O5 where two hydrogen replaced by 2-hydroxyl group as shown in Figure1(b), due to presence of hydroxyl group at second stage of glycolysis it completely stop the production of glucose-6-phosphate from glucose and it also affect some other molicular process. Similarly to D-glucose, 2-DG transported across the blood–brain barrier (BBB) and quickly taken up into cells by particular glucose transporters, via Sodium-glucose co-transporters (SGLT) [2,3]. Inside of cells, 2-DG phosphorylated into a charge compound 2-deoxy-d-glucose-6-phosphate this compound trapped inside of cell. It do not undergo isomerization to fructose-6-P leading to intracellular accumulation of 2-DG-6-P because of absense of 2 (-OH) group it inhibit process of glycolysis. As glucose 2-DG is relatively non-toxic and orally available, it is being used in anticancer therapy [4], when treated with 2-DG showed RT-PCR negative conversion in COVID patients. It accumulated in virus-infected cells and prevents virus growth by stopping viral synthesis and energy production and reduces oxygen demand upto 40 per cent.Its diagnostic potential has been widely explored, but therapeutic applications have yet to be achieved [5,6,7,8].
It present paper structural, physical and electronic propeties of D- glucoase and 2DG based on density funcution theory (DFT) by using siesta will be discussed. This programme has become quite popular among researchers working in geosciences, biology, engineering and material science [9]. Coperation of different orbitals in conduction and velence band and change in energy level and band gap energy during formation of glucose and 2DG are also discussed. Attempts to improve 2-DG’s drug-like properties, its role as a potential adjuvant for other chemotherapeutics, will also be discussed.
Results and Discussion
Density-functional theory (DFT) is a successful theory to calculate the electronic structure of atoms, molecules, and solids Its goal is the quantitative understanding of material properties from the fundamental laws of quantum mechanics [10]. This theory is computationally less intensive than other methods with similar accuracy [11,12]. All calculations are performed by using the SIESTA (Spanish Initiative for Electronic Simulations with Thousand of Atoms) code [13,14], where a numerical atomic basis approximation is implemented which is rather fast and appropriate for electronic structure calculations of large systems [15,16]. The main feature of this code is to use flexible basis sets composed of linear combinations of numerical atomic orbitals, which can be generated by solving the Kohn–Sham equation of atomic pseudo potentials [17]. The equilibrium positions of the atoms are obtained by the forces on each atom smaller than 0.01 eV/Å. The structural optimization of D-glucose and 2DG is performed mainly by mesh cut- off, k-points and simulation box size (i.e. the lattice constant) opti- mizations. Mesh-cutoff corresponds to fineness of the real-space grid; its convergence test is performed in the range of 50 to 500 Ry. On the basis of lowest and stable energy, the calculated mesh-cutoff of both systems are 450 Ry and 350 Ry, respectively. In the next step of geometry opti- mization, k-points are optimized in the range of 2–12 and its value corrosponds to lowest energy values for both system is found to be 5. By the optimized values of mesh-cutoff and k-points; the cell size is optimized in the range of 6.0–12.0 Å. According to minimum energy, optimized values are 1.5 Å & 1.15 Å, respec- tively.
The optimized structure of D-glucose and 2DG along with bond length using Jmol programme are shown in Figure 1 (a) and Figure 1 (b) respectively. The bond angles between different atom of optimized structure are measured, in case of D-glucose bond angles are as follows C-C-C (110.6840), O-C-C (112.4500), H-C-H(107.6940),O-C-O (106.1940), C-O-H (104.7720), and in glucose -2DG these angles are C-C-C (109.2060 ), O-C-C (110.4860), H-C-H(107.6940),O-C-O (106.1940), C-O-H (106.9010). It can be seen that when D-glucose changes 2DG there is no changes in H-C-H and O-C-O bond angle but all other bnad angle slitely changes. Bond angle and bond length between atoms at some places decreases. These changes is due to incoperation of hydroxyl group in place of hydrogen. Oxygen present in -OH group is more electronegative in natue, it apply strong attraction on neghbouring carbon and hydrogen atom, due to which band angle as well as bond length decreases [18.19.20] The atoms in 2DG case are more tightly bounded with each other hence it do not perform glycolysis.
Methodology
Non-conserving pseudo potentials are used with the follow-ing electronic configuration of the elements: H: 1s1, C[He] 2s22p2 , O [He] 2s22p4 where the core configurations are shown in parenthesis. A generalized gradient approximation (GGA) one of the approximations to the exchange-correlation energy functional in density functional theory (DFT) for calculating total energy by first principle calculation from Schrodinger equation.is used in the scheme of Perdew–Burke–Eruzerhof (PBE) [19,20] describe the exchange and correlation potential, since GGA is found relatively more efficient to predict the energy gap than the local-density approximation (LDA) [21].
Molecular Electrostatic Potential
Molecular Electrostatics Potential (MEP) surface analysis is one of the tolls which can play main role in the linear/bipodal receptor lesigning [22]. The molecular electrostatic potential (MEP) mappings are being logically used in scientific research for over thirty plus years [23]. Molecular electrostatic potential surface (MEP) of both the molecule mapped with the output optimized by Siesta is generated by Xcrysden programme is shown in Figure 2 (a & b). It depict net electrostatic effect, produced by the total charge distribution (electrons and nuclei) of a molecule at a point in space around it. It also provides visual method to understand the relative polarity of molecule which correlates the total charge distribution with dipole moments, partial charges, electronegativity and site of chemical reactivity of a molecule. Different values of electrostatic potential at the surface are represented by different colors. Red colour represents regions of most negative electrostatic potential, blue colour represents regions of most electro positive ESP and green colour represents regions of zero potential.
The negative electrostatic potential (red regions) is localized over the oxygen atom that corresponds to an attraction of the proton by the aggregate electron density. The most positive regions (blue regions) correspond to proton repulsion (shaded as blue) are localized over hydrogen atoms. Total electron density depicted by Figure 3(a&b) represent that it is uniform through whole the molecular vicinity. It also represent that there is not active sides in 2DG moliculae as that appear in glucose i.e. it can not allow to other species to intrect and react with them. Position of different atoms alognwith molicular surface is also depicted in Figure 4 (a&b).
Charge density analysis
The nature of chemical bonds can be understood by the analysis of charge density using XcrySDen. It can display properties such as charge densities, molecular orbitals, or any other 2D or 3D scalar field as isosurface or contours. The XSF file obtain by SIESTA output use to display the isosurfaces. Figure 5 and Figure 6 shows chanrge density of D-glucose and 2DG at different resolutions [24,25]. It is observed that in both compound C-C and C-H bond are covelent in nature while C-O bond are partially convent and partially ionic which leads to localized wave functions (shown by concentric spheres) centered at atoms with a smaller degree of overlap. But in 2DG due to incoperation of 2 OH group the C-C bond attached with Oxygen become stronger and shows partually ionic nature. The charge density distributions in the systems are approximately smilar, it is higher in the inner-most region (magenta), and lower in the outer most regions (red). Higher charge density is observed around oxygen since the ionization energy/electro- negativity of oxygen atom is higher than other atoms present in compound, also concentric circles around oxygen atoms represents to an ionic bondwith, there is distortion in circles between carbon and oxyge which is an indication of a covalent bond between them.
3.3 Density of States Analysis
Density of states (DOS) and projected density of statesFigure 5: Distribution of Charge density of D-GlucoseFigure 6: Distribution of Charge density of Glucose 2DG (PDOS) provide quick qualitative picture of the electronic structure of a material. The projected density states (PDOS) and density of states (DOS) of hydrogen, carbon and oxygen atoms obtain by Siesta output analyxed by Xmgrace programme are presented in Figure6 and in Figure 7 respectively. It is observed from Figure 6 (a) that, in D-glucose 2p orbital of oxygen shows larger contribution in lower velence band and highest peak obtained at -3.98 eV, electrons of 1s orbital of hydrogen, 2p orbital of carbon and 2s orbital of oxygen are also contribute in velence band. In conduction band electrons of 1s orbitals of hydrogen highly countributed and shows highest peak corrosponds to 3.86 eV, there is little contribution of 2p and 2s electrons of C and 2p electrons of oxygen showing smaller peak near conduction band and larget paeak at 5.25eV.
In Figure 6(b) the density of states (DOS) analysis presents the sp hybridization between s-states of hydrogens and p-states of C and O, and formation of sigma boond between O (2s) and H (1s) robital in velence band [26, 27]
The highest occupied molecular orbital (HOMO) is at around -1.71 eV and the lowest un-occupied molecular orbital (LUMO) is at around 2.81eV, thus forbidden energy gap for D-Glucose is 4.52eV, which shows ensulating behaviour, the valence band is continues from -5.0 eV to -1.71 eV and conduction band from 2.81eV to 5eV.
PDOS elements of glucose-2DG is shown in Figure 8a, there is a slight shift in peaks of 2p- states of C and O, and 1s states of hydrogen towards Fermi level. There is a peak of H(1s), C(2p) and O(2p) -states at -2.36 eV near higher energy level of velence band. It also represent sp- hybridization ,and shifting of whole band towards Fermi level with broader width. In conduction band there is large contribution of H(1s) electrons whose peak stars from 2.76 eV i.e. near lower energy level of conduction band and moderate contribution of C(2p) electrons and a few contribution of C(2s) and O(2p) electrons which shows very small peak beyond 5.8eV. Total density of states is shown in Figure 8(b). Before Fermi level (-2.13eV) there is a broader valence bands called HOMO and conduction band is obtained after LUMO around 2.20 eV, the forbid- den energy gap is around 4.33 eV.
Acknowledgments
Authors are grateful to Dr M L Verma (HOD, SSGI Bhilai) and Dr B Keshev Rao (Professor SSGI, Bhilai) and to the management of Shri Shankaracharya Technical Campus-SSGI to avail research facilities for providing lab facility to their campus and special guidance to lean SIESTA. Ialso thanks to Mr. Anand Tripathi (Chairman KEC, Bhilai), Mr. Abhishek Tripathi (Director KPSI, Raipur) and Ms Vinita Mairal (Principal KPSI Raipur) for providing overall support to complete this research work.
Conclusion
It is observed form MEP analysis that there is less reactive sites in 2DG phase as compare to D-glucose phase. Charge density analysis represents that covelent bond in more dominated in 2DG while bonds in D-glucose are more ionics. From PDOS and DOS analysis it is found that there is slide change in forbiden energy gap during changes from D-glucose phase to 2DG phase. It also shows that countribution of 2p electron of carbon and oxygen is larger in velence band while, 1s electrons of hydrogen and 2p electrons or carbon equaly corporate. In conduction band 1s electron of hydrogen play main role as compare to 2p of carbon and oxygen, but in 2DG the peak corrosponds to H(1s) electrons decreases which shows that here some H has been replaced by OH groups. Thus incorporation of OH in place of H in glucose the reactivity of 2DG phase decreases, as conduction band electrons are more responsible of chemical reaction therefore it become less reactive and comapre to D-glucose, hence inhibit glycolysis process[28,29.30]. Thus it gets aggregated inside the cell and cuts off the growth material required for the virus to grow hence DRDO suggested it as a drug for Covid-19 treatment and showing much higher recovery.
- Kamide, Kenji 2005 (1st ed) Cellulose and Cellulose Derivatives (Amesterdam: Elsevier).
- Lagana SM, Taub RN, Borczuk AC (2012) Utility of glucose transporter in the distinction of benign and malignant thoracic and abdominal mesothelial lesions. Arch Pathol Lab Med.136: 804–9.
- Li S, Yang X, Wang P, Ran X (2013) The effects of GLUT1 on the survival of head and neck squamous 3cell carcinoma. Cell Physiol Biochem. 32: 624-34.
- Park GB, Yoon H Chung, Daejin Kim (2017) 28: 410-20. doi:10.1097/CAD. 00000072
- Xi H, Kurtoglu M, Liu H, Wangpaichitr M, You M, et al. (2010) 2-Deoxy-d-glucose activates autophagy via endoplasmic reticulum stress rather than ATP depletion”. Canc ChemotherPharmacol. 67: 899-910.
- Aft RL, Zhang FW, Gius D (2002) Evaluation of 2-deoxy-D-glucose as a chemotherapeutic agent: Mechanism of cell death. Br J Cancer 87: 805-12
- Magier Z, Jarzyna R (2013) The role of glucose transporters in human metabolic regulation. Postepy Biochem. 59: 70-82.
- Gupta S, Farooque A, Adhikari JS, Singh S, Dwarakanath BS (2009) Enhancement of radiation and chemotherapeutic drug responses by 2-deoxy-D-glucose in animal tumors J Can Res Ther. 5: 16-20.
- José M Soler, Emilio Artacho, Julian D Gale, Alberto García, Javier Junquera, (2002) Journal of Physics: Condensed Matter 14: 11.
- Encyclopedia of Condensed Matter Physics Reference Work 2005 ISBN 978-0-12-369401-0 Academic Press.
- Vrugt Michael, Lowen Hartmut Wittkowski, Raphael (2020) Classical dynamical density functional theory: from fundamentals to applications”. Advances in Physics 69: 121–247
- Evans Robert Oettel, Martin Roth, Roland Kahl Gerhard (2016) New developments in classical density functional theory”. Journal of Physics: Condensed Matter. 28: 240401.
- Martin RM (2004) Electronic Structure: Basic Theory and Practical Methods, Cambridge University Press.
- Artacho E, Cela JM, Gale JD, Garcia A, Junquera J, et al. (2011).
- José MS, Emilio A, Julian DG, Alberto G, Javier J, et al. (2002) J Phys Condens Matter 14: 2745.
- Ordejón P, Artacho E, Soler JM (1996) Phys Rev B 53: 10441.
- Kang HT, Hwang ES (2006) 2-Deoxyglucose: 2006 An anticancer and antiviral therapeutic, but not any more a low glucose mimetic. Life Sci 78: 1392-9.
- Cao X, Fang L, Gibbs S, Huang Y, Dai Z, et al. (2007) Glucose uptake inhibitor sensitizes cancer cells to daunorubicin and overcomes drug resistance in hypoxia. Cancer Chemother Pharmacol 59: 495-505
- Kang HT, Hwang ES (2006) 2-Deoxyglucose: An anticancer and antiviral therapeutic, but not any more a low glucose mimetic. Life Sci 78: 1392-9.
- Shutt DC, O’Dorisio MS, Aykin BN, Spitz DR (2010) 2-deoxy-D-glucose induces oxidative stress and cell killing in human neuroblastoma cells. Cancer Biol Ther 9: 853-61.
- Jeffrey CO, James M G, Craig V L 2012 Behavioral, cognitive, and safety profile of 2-deoxy-2-glucose (2DG) in adult rats, Epilepsy Research 101: 246-52.
- Sudha LN, Vanthana J, Kumaresan M, Narayan S (2021) Molecular electrostatic potential (MEP) surface analysis of chemo sensors: An extra supporting hand for strength, selectivity & non-traditional interactions. J Photochemistry and Photobiology 6: 100022
- Gray FM (1991) Solid Polymer Electrolytes: Fundamentals and Technological Applications. Scotland, New York: Wiley-VCH, Weinheim: 245
- Keshav B Rao, Verna ML (2016) Chemical Physics Letters 661: 2745.
- Zhang RQ, Zhang QZ, Zhao MW (2004) Theor Chem Acc 112: 158.
- Nilsson A, Pettersson LG (2004) Sci Rep 55: 49-167.
- Bligaard T, Noskov JK (2008) Chemical Bonding at Surfaces and Interfaces 1st edn (Elsevier, Amsterdam).
- Gray FM (1997) Polymer Electrolytes, The Royal Society of Chemistry, Cambridge: 175.
- Aghaee F, Islamian JP, Baradaran B (2012) Enhanced Radiosensitivity and Chemosensitivity of Breast Cancer Cells by 2-Deoxy-D-Glucose in Combination Therapy. J Breast Cancer 15: 141-7
- Maher JC, Krishan A, Lampidis TJ (2004) Greater cell cycle inhibition and cytotoxicity induced by 2-deoxy-D-glucose in tumor cells treated under hypoxic vs aerobic conditions. Cancer Chemother Pharmacol 53: 116-22.
- Aft RL, Zhang FW, Gius D (2002) Evaluation of 2-deoxy-D-glucose as a che- motherapeutic agent: mechanism of cell death. Br J Cancer 87: 805-12.
FIGURE 1
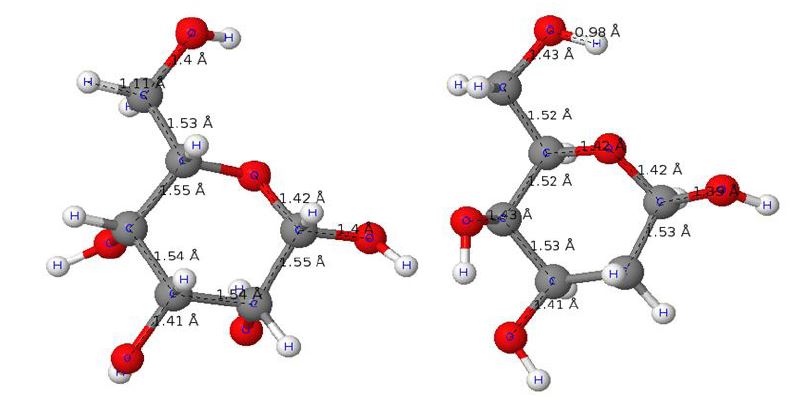
Figure 1: Structural configuratio of (a) D-Glucose and (b)Glucose 2DG
FIGURE 2
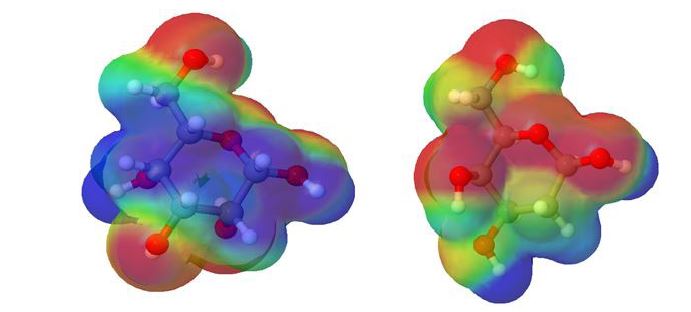
Figure 2: Molecular electrostatic potential surface (MEP) of (a)Glucose-D (b)Glucose-2DG
FIGURE 3
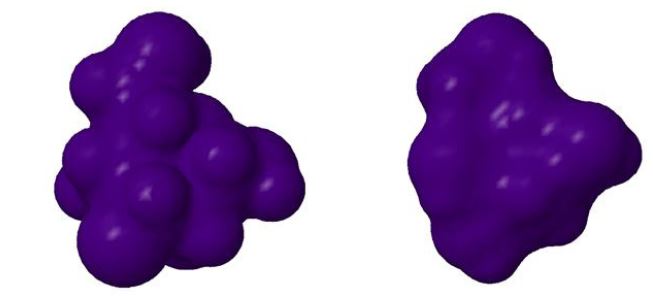
Figure 3: Total electron density of (a)Glucose-D (b)Glucose-2DG
FIGURE 4

Figure 4: Position of different atoms with molicular surface: (a) D-Glucose (b) Glucose -2DG
FIGURE 5

Figure 5: Distribution of Charge density of D-Glucose
FIGURE 6
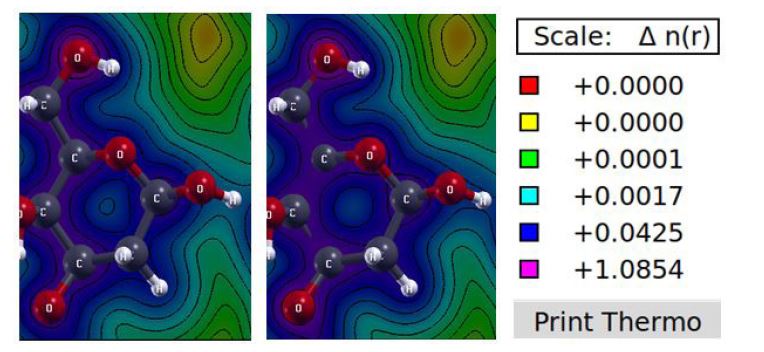
Figure 6: Distribution of Charge density of Glucose 2DG
FIGURE 7
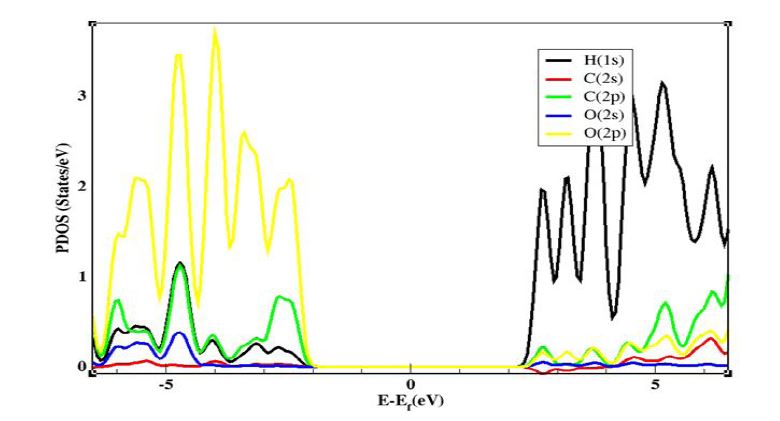

Figure 7: (a) PDOS and (b) DOS analysis of D- glucose
FIGURE 8
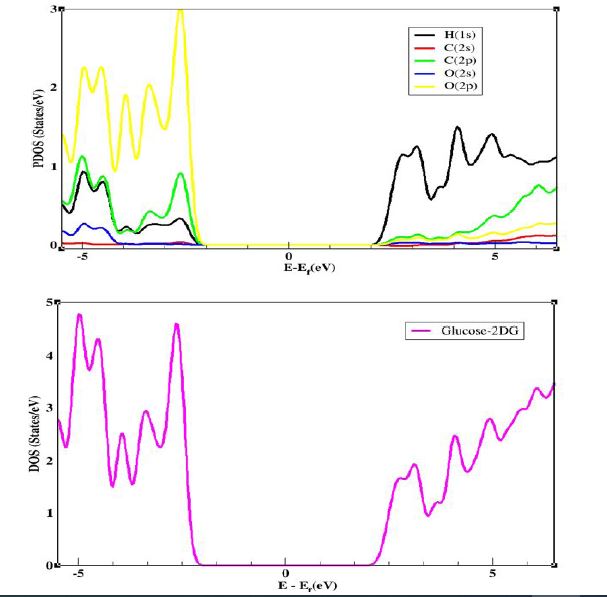
Figure 8: (a) PDOS and (b) DOS analysis of glucose-2DG
Tables at a glance
Figures at a glance