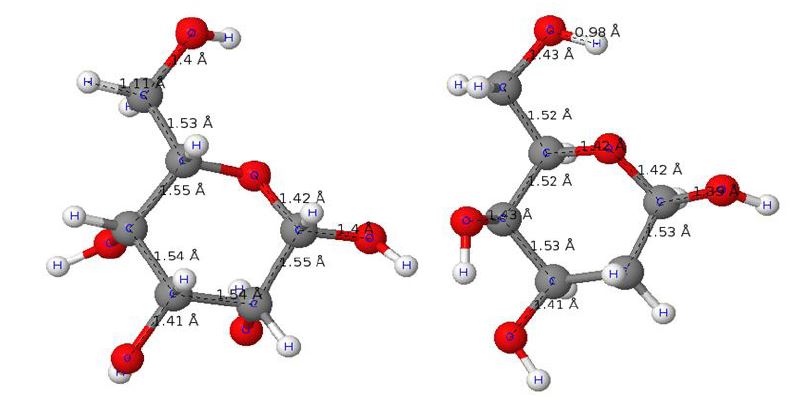
Figure 1: Structural configuratio of (a) D-Glucose and (b)Glucose 2DG
Figure 1: Structural configuratio of (a) D-Glucose and (b)Glucose 2DG
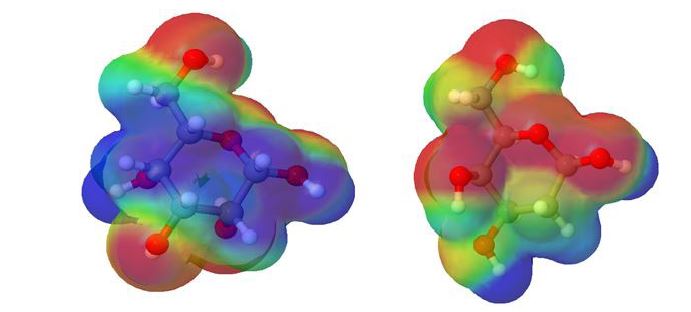
Figure 2: Molecular electrostatic potential surface (MEP) of (a)Glucose-D (b)Glucose-2DG
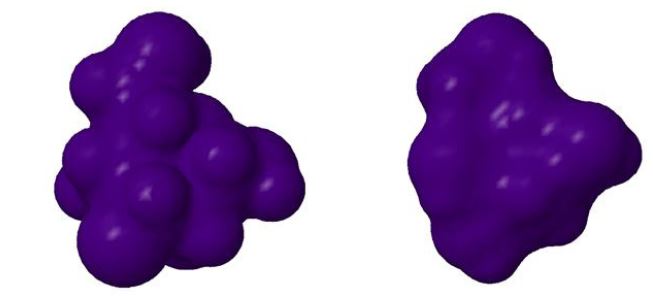
Figure 3: Total electron density of (a)Glucose-D (b)Glucose-2DG

Figure 4: Position of different atoms with molicular surface: (a) D-Glucose (b) Glucose -2DG

Figure 5: Distribution of Charge density of D-Glucose
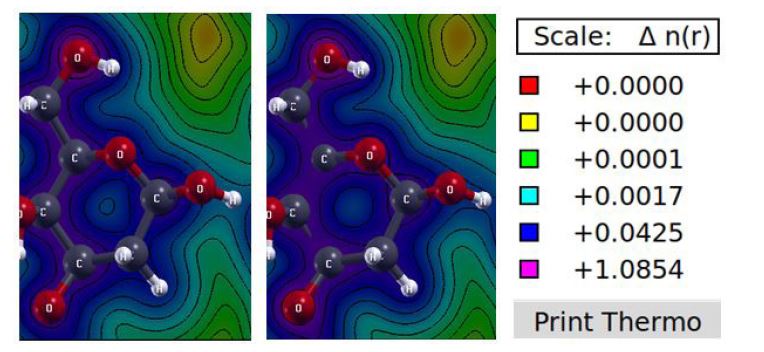
Figure 6: Distribution of Charge density of Glucose 2DG
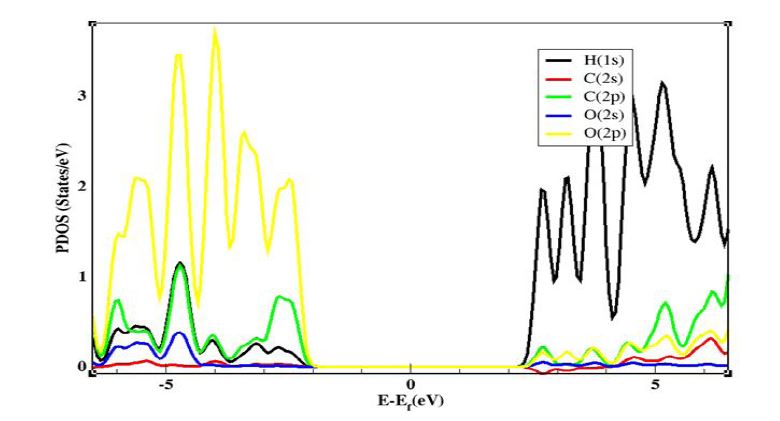

Figure 7: (a) PDOS and (b) DOS analysis of D- glucose
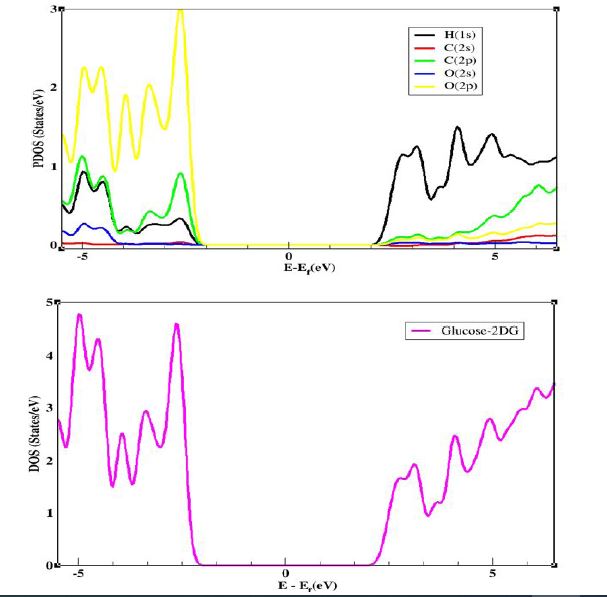
Figure 8: (a) PDOS and (b) DOS analysis of glucose-2DG
Tables at a glance
Figures at a glance