Multi-response Design optimization of Cardiovascular Catheters with Lasercut Hypotubes using Finite Element Analysis and Response Surface Methodology
Received Date: June 10, 2023 Accepted Date: July 10, 2023 Published Date: July 13, 2023
doi: 10.17303/jber.2023.7.102
Citation: Karthik Bujuru, Rajesh Kandula, Surya Kiran Aedma (2023) Multi-response Design optimization of Cardiovascular Catheters with Lasercut Hypotubes using Finite Element Analysis and Response Surface Methodology. J Biomed Eng Res 7:1-16
Abstract
Cardiovascular catheters design while balancing the tensile, torsion and bending performance outputs to achieve optimal performance is a challenge. Lasercut Hypotubes as a catheter’s structural member provide an option to achieve the desired mechanical properties. This paper presents a case study to detail the process of designing an interrupted spiral cut pattern hypotube as a structural member while using Finite Element Analysis (FEA) test simulations along with Minitab’s Central Composite Design (CCD) Response surface Methodology (RSM) for multi-response design optimization. The optimized design identified by this methodology, presented in the case study, showed that the tensile, torsional, and bending stiffnesses predicted by the RSM model compared to that of FEA simulation data with 20%, 1% and 35% error. The large percentage error for one of the responses (>20%) was attributed to the high residual error in the Minitab’s model. For further improvement in the Minitab’s model prediction, a DOE design to include full factorial design of experiments for additional data,identification of potential outliers due to sensitivity of FEA simulations compared to that of real-world data are recommended.Overall, this paper detailed the process of modeling a Lasercut hypotube design and the methodology to optimize the LCH design based on FEA simulation data and RSM without the need for cost prohibitive prototype iteration process in the design of structural heart catheters.
Keywords: Cardiovascular Catheters; Lasercut Hypotubes; Finite Element Analysis; Response Surface Methodology; Interrupted spiral cut pattern
Introduction
The development of cardiac catheterization has revolutionized the diagnosis and therapy of cardiovascular diseases [1]. Adequately designed catheters in intracardiac procedures have become necessary to allow for atraumatic navigation of patient vasculature, adequate positioning, and placement of cardiovascular implants [2]. The parameters affecting the successful procedural outcomes in cardiac intervention include the operational skills of the cardiologists, visual navigational systems used to navigate the complex three-dimensional structure of the heart, and the catheter’s ability to adapt and maneuver the distinct anatomy of the patient to deliver the diagnostics or the therapy [3,4]. The complexities of catheter design are primarily centered around the aspects of lack of better understanding of physician user needs, distinct patient anatomies, and non-linear relationship between the catheter’s mechanical outputs and its design parameters. Typical cardiovascular catheters have multitude of design requirements such minimal OD profile to minimize patient trauma at the access site, able to adapt and track through the patient’s vasculature without causing harm, able to bend a difficult turn and reach the treatment target site, able to steer to align with the native annulus, able to deploy a prosthetic valve and being able to be safely withdrawn from the patient. Some of these requirements are translated to pushability, trackability/flexibility and torqueability characteristics of the catheter. Table 1 serves for a more comprehensive understanding of the relationship between the clinical needs, mechanical outputs and the design options associated with catheter development. As can be derived from the information in table 1, to achieve the desired mechanical properties for the catheter shafts available design options are often in conflict of each other- which requires a judicious optimization [5].
Polymers based catheters design article discussed the considerations for catheters design and listed attributes to optimize to achieve desired tension/compression, bending and torque by choosing an optimized configuration of jacket material, geometry, braid type and density to achieve the required trackability, bendability and torsional strength in the catheter [2]. While there are extensive advancements in the transcatheter heart valve interventions in the last decade,there is a desire in the physician community to make the transcatheter procedures safer, easier, and more reliable [6]. Specifically, the cardiovascular catheters experience high tensile and compressive forces due to the force required to unsheathe an implant that exerts high radial force,therefore a shaft design that can withstand high tensile and compressive forces with minimal stretching while also being able to bend easily for better trackability are required.
While using a metal braid as a structural member of the catheter allows for designing a catheter to meet the desired mechanical properties but it is challenging to balance them all.This optimization is identified to be more feasible with the laser cut reinforced shafts that use polymer lined long stent struts which are solid metal shafts with distinct patterns cut onto them using precision laser cutting [7]. The Lasercut reinforced shafts also allow for better kink resistance by maintaining minimally distorted shape when under bending force, and low-profile OD as the thin-walled laser cut tubes allow for desired mechanical properties. In-vitro analysis reported by Inam et al. [8], have reported that the laser cut reinforced shafts have improved mechanical characteristics than their braided counterparts in ovality retention, flexural rigidity, torque transmission and pushability [8].
The advent of recent technological advances in the field of precision laser cutting allowed for designing intricate laser cut patterns on metal tubes. These Lasercut patterns are chosen based on the desired mechanical characteristics of the catheter [5]. There are several types of Lasercut patterns that allow for specific mechanical functional output such as continuous spiral pattern, I-cut pattern, jigsaw pattern, interrupted spiral pattern etc. For instance, the spiral pattern generally results in highly flexible shaft but poor torque performance; the I-cut pattern offers lesser flexibility than the spiral pattern but has better pushability and torque transmission; the jigsaw cuts pattern allows for better flexibility, pushability and torque transmission but entails high manufacturing costs. Amongst all the commonly available Lasercut patterns, we have identified that the interrupted spiral cut pattern allows for greater design flexibility in defining the desired mix of catheter’s mechanical properties.
In this paper, we present a case study to detail the process of design and optimization of interrupted spiral (IS) laser cut pattern hypotube used in a cardiovascular catheters using Finite Element Analysis (FEA) simulated mechanical tests and Response Surface Methodology (RSM).
Materials and Methods
Lasercut Hypotube Model
Computer Aided Design (CAD)-Solidworks- was used to develop an IS Lasercut hypotube model. The ID,OD French size, and the length of the hypotube is set to be constant for this study. Figure 3 shows the Lasercut model used and some of the features that are used to define it.
For developing a fully defined CAD model for interrupted spiral LCH pattern, the parameters listed in Table 2 are required for the chosen size and the length of the hypotube.
For parametrization of the CAD model, the number of slots per rotation was set to a constant value which led to constant total number of slots for the given length of a hypotube. This allowed for using Slot length, spiral pitch and slot width as the 3 parameters used to fully define the chosen interrupted Lasercut hypotube model, while uncut length between slots was indirectly controlled given the constant total number of slots. Table 2 lists the chosen parameters to fully define the LCH, while Table 3 lists the constant values used for some of the design inputs of the LCH Model.
Experimental Tests-FEA Simulations
Based on the characterization data available on a predicate device, a few FEA simulated mechanical tests using the test methods detailed below were run using ABAQUS software to collect the preliminary data on the correlation between the design inputs (slot length, spiral pitch, and slot width) and the responses (tensile, torque and bending stiffnesses). This allowed for preliminary estimates for the target ranges for each of the design inputs that the response optimization should be focused on. Table 4 lists target ranges used for this study.
Finite Elements Analysis (FEA) in ABAQUS software was used to execute simulated mechanical tests to record experimental data related to torque, tensile and bending responses of the Lasercut hypotube. The parameters for the material model used are listed in table 5. ABAQUS software uses quasi-static simulations to solve the computational mechanics problems associated with the tests. Analysis of this nature assumes that the tests occur at infinitesimally slow rate, but consider the effects of inertia and viscoelastic behavior to an extent. The loading in these simulations is applied incrementally in infinitesimal steps to capture the mechanical behavior of the subject under test [9].
3-pt Bend Test
FEA model boundary conditions followed the requirements of the ASTM D790-03 standard with span length (L) to shaft diameter(d) following 16 to 1 ratio.. The test setup for bending in FEA is shown in Figure 5. The 1.5 inches length of the sample is simply supported on the 2 rounded supports that are mathematically rigid surfaces,and a similar rounded support is brought down to exert the bending load on the sample to record the bending reaction forces with displacement. The slope calculated from the linear section of the plotted bending force to displacement curve yields the bend stiffness of the LCH. See Figure 6.
Torsion Test
3.3 Density of States Analysis
One end of the 1.5 inches length sample is fully constrained (fixed boundary conditions) in all 6 degrees of freedom while the other end is torqued radially to record torque moments with respect to radial displacement. The FEA test model setup for torque is shown in Figure 7. The radial displacement of the LCH in response to applied torque is plotted, and the linear section of the curve is used to calculate the slope to determine the torsional stiffness of the LCH. See Figure 8.
Tensile Test
One end of the 1.5 inches long sample is fully constrained (fixed boundary conditions) in all 6 degrees of freedom while the other end is applied with pull force to record the tensile reactionary forces with respect to displacement.The FEA test model setup for tension is shown in figure 6.The slope calculated from the linear section of the plotted tensile force to displacement curve yields the tensile stiffness of the LCH.
Experimental Design and Statistical Analysis
As shown in Tables 6 and 7, 20 designs of laser cut hypotube with cut width (0.003 in- 0.007 in), arc cut length (0.056 in- 0.084in), and spiral pitch (0.020 in-0.035 in) were used for the optimization procedure based on a three-factor central composite design (CCD). As shown in Table 7, the center point was repeated six times. In real world experiments, the center point is repeated to show repeatability [10], however, the outputs don’t change in FEA simulation iterations when the test setup and boundary conditions don’t change. But the six center points were still included to adhere to CCD test methodology. Analysis of variance (ANOVA) and regression surface analysis were conducted to determine the statistical significance of model terms and fit a regression relationship relating the simulation data to the input variables. The generalized response surface model for describing the variation in response variables is given below.
where y is the response value predicted by the model;η0 is an offset value; η1, η2, and η3 are main (linear), quadratic and interaction regression coefficients, respectively.The model adequacy was confirmed using model analysis,lack-of fit test and coefficient of determination (R2) analysis.The value of Regression coefficient (R2) required to be least 0.80 for a good fitness of a response model [11]. The corresponding variables will be statistically significant (p≤0.05) if the absolute t value increases and as the p-value decreases [12]. The terms that are found to be statistically insignificant(p>0.05) were removed from the initial response models and the experimental data was refitted to ensure that all the independent variables are statistically significant before finalizing the reduced regression model. The CCD design of experiments planning, and the data analysis was performed using Minitab v. 20.2 statistical analysis software.
Optimization and Validation Procedures
The study evaluated the combined levels of Lasercut hypotube geometry parameters like slot width (SW),slot length (SL) and spiral pitch (P) to identify a design with the desired mechanical properties related to tension, torsion and bending of the catheter. Each of these mechanical outputs were required to achieve a catheter design that meets the application criteria of physician users, while considering that optimal level for one input variable for one response (individual optimal region) can be far from the optimal region for another response. Therefore, all the mechanical responses need to be analyzed simultaneously for multiple optimization process. For the present study, target ranges for each of the response variables were set based on the predicate device characterization data and the user requirements of the new device. Table 8 lists the target range for each of the responses.
For multi response optimization, Minitab’s graphical optimization procedures were used to identify optimum design region of slot width, slot length and the spiral pitch that result in the optimal responses. For optimization, the final reduced regression models were expressed as three-dimensional (3D) response surface plots to visualize the interaction effect of LCH geometrical variables on catheter’s mechanical responses. The 3D plots were presented by holding one design variable constant at center point of the range while varying the other two design variables to show how each response variable is related to two continuous design variables. For identifying the optimal design region that meets the target response ranges for each of the responses, Minitab’s overlaid contour plots were used [13]. The three (3) responses with their targets set the levels specified above, were plotted against all possible combinations of design variables while holding the third design variable constant at low, mid, and high levels yielding a total of 9 overlaid contour plots. Each of the 9 contour overlaid contour plots are then analyzed for design regions where the target ranges for each of the response variables are met. For method validation, FEA simulation data was compared with the regression model predicted values in order to verify the adequacy of final reduced models.
Results and Discussion
Data Analysis
The regression coefficients for the response variables with corresponding R2 value, F-value and p-value for lack of fit, are provided in Table 9. Each response variable (yi) was assessed as a function of main, quadratic and interaction effects of slot width (x1), slot length (x2) and spiral pitch (x3). The regression models were reduced by removing the squared and interaction effects that had insignificant effect on the model with p>0.05. The reduced models indicated that the coefficient of determination (R2) for the responses was ranging from 0.803 to 0.969, and that they were significantly (p<0.05) fitted for all response variables studied. Thus, more than 80% of variability of the Lasercut hypotube mechanical properties can be explained by the RSM models as a nonlinear function of design variables. As shown in Table 9, all the three design variables have significant (p < 0.05) effect on the responses, therefore they were all preserved in the final reduced model. The quadratic effect of slot arc length (SL) and the quadratic effect of spiral pitch (P) are kept in the final reduced response models of tensile stiffness and torsional stiffness respectively, as they had significant (p<0.05) effect on these responses. None of the interaction effects are included in any of the final response models as they didn’t have statistically significant (p>0.05) on the responses. Also, as noted by Montgomery [11], the polynomial regression models are considered to be significant (p<0.05) only in the design variable ranges considered in the study and may not be valid beyond. Therefore, the regression models for the responses cannot be extrapolated beyond the ranges studied. Also, as noted by Montgomery [11], the polynomial regression models are considered to be significant (p<0.05) only in the design variable ranges considered in the study and may not be valid beyond.Therefore, the regression models for the responses cannot be extrapolated beyond the ranges studied.
Tensile Stiffness
As shown in Table 9, the tensile stiffness (y1) was negatively associated with main effects of slot width and slot arc length as well as the interaction effects of slot width/spiral pitch and slot length/spiral pitch combinations. Only the 3 main effects, and the quadratic effect of slot arc length indicated statistically significant (p<0.05) effect on the variations in tensile stiffness response. All other quadratic and interaction effects were insignificant (p>0.05) and were removed from the final reduced model for the tensile stiffness.The final reduced model has a regression coefficient (R2) of 0.808 which confirms that the 80% variability in the response is explained by the model for the inputs Lasercut hypotube design variables.
As indicated by the surface plots in Figure 11, the tensile stiffness reduces as the SW and the SL increase in value,while it increases with increase in spiral pitch. The surface plots also indicate curvature in the relationship between the independent interaction effects associated with slot length and the tensile response.
Bending Stiffness
As indicated in Table 9, the initial regression model indicated that the slot width and slot length have significant (p<0.05) negative effect on the bending stiffness, while the spiral pitch has significant (p<0.05) positive effect. The quadratic effect of slot length also shows have significant effect in the initial model, the subsequent reduction of the regression model which included all the main effects and the quadratic effect of slot arc length, showed that the quadratic effect of slot length diminished and became insignificant (p>0.05). Therefore, the final reduced regression model with regression coefficient of 0.803, as indicated in table 10, showed that only the main effects have statistically significant effect on the bending response while other quadratic and interaction effects were insignificant.
The 3D surface plots (Figure 12) indicate that the relationship between the bending response variable and the LCH design variables is linear without any curvature in the response due to the lack of quadratic and interaction effects in the bending response model. Overall, the response model indicated that the bending stiffness decreases with an increase in slot width, slot length and decrease in pitch.
Torsional Stiffness
The initial regression model, with parameters listed in Table 9, indicated that slot width and slot length have statistically significant (p<0.05) negative effect, while spiral pitch have statistically significant (P<0.05) positive impact on the torsional stiffness response. The quadratic effect of spiral pitch also has significant impact, while all other quadratic and interaction response are statistically insignificant (p>0.05). The final regression model is obtained by removing the insignificant terms and has regression coefficient (R2) of 0.975 which indicates that the 97.5% of variability in the torsional stiffness response is explained by the model.
The 3D surface plot (Figure 13) shows a linear relationship between the torque response and the interaction between the main design variables of slot width and slot length. A curvature of the response surface is observed with main interactions involving spiral pitch.
Overall, the model indicates that the torque response increases with decrease in slot width and slot length, and increase in spiral pitch whilethe interaction effects between design inputs are not statistically significant per the model and can be ignored.
Optimization Procedure for Targeted Responses
For graphical optimization method, contour overlaid plots are shown to be an effective methodology for optimized design region identification [13]. A total of nine (9) overlaid contour plots are obtained, with 3 different combinations of design variables while holding the third design variable at a constant value of low, mid, and high levels. The contour lines for each of the responses are set to the target
range identified previously in this paper. All the overlaid contour plots are analyzed for feasible design regions for all 3 response variables combined. As noted in figure below,feasible design regions (indicated in white) were identified in Pitch vs SL (SW constant at 0.007), SL vs SW (Pitch constant at 0.020), SL vs SW (pitch constant at 0.0275), Pitch vs SW (SL constant at 0.056) and Pitch vs SL (SW constant at 0.005). The design regions in all these plots, as seen in Figure 14, indicated similarity of design variable ranges where the design is feasible.
Pitch vs SW (SL constant at 0.056) visually represented a larger design region for potential feasible designs.Each coordinate in this feasible region represents an optimized design solution for the LCH, and a few designs can be selected for further verification and design development.
Verification of Response Surface Models
The adequacy of the RSM model used is checked by comparing model predictions for responses against the FEA simulation data. A few data points were selected from the feasible design region of the Pitch vs SW (SL constant at 0.056) to cover the majority of corners of the design area, and FEA simulations are run to collect the response data. The percentage error between the model predictions and FEA simulation data was calculated to select the best possible design that has the least calculated error. Figure 15 shows the coordinates selected in the design area, and Table 11 below shows the computed error between the Minitab’s model prediction and the FEA simulation.
As noted in Table 11, the percentage error calculated for the Tensile and Torque responses are less than 20%,while the bending response has calculated error of 35% between the Minitab model prediction and the FEA simulation data. The factors causing large variance between the statistically significant (P<0.05) and high regression coefficient (R2>0.80) model and the experimental data can be low R-sq(pred) values for tensile and bending responses (47% and 55% respectively) due to high residual errors in the regression models used for these responses. This indicates high residual error between model predicted values and the experimental data. This may be attributed to lack of adequate experimental simulation data that includes multiple levels between the chosen low and high levels of the design inputs while in the current data pool there is only one center point. Due to data inadequacy, some of the interaction effects between the main factors may be shown to be statistically insignificant, while in reality they may be significant. The error between experimental simulation data and the model’s prediction could be due to presence of outliers that could be skewing the data.
While further optimization of the Minitab’s model is outside the scope of this paper, the designer may need to draw a correlation between the FEA data and real-world experimental data for simulation data validation. Based on the correlation the regression model may need to be adjusted based on the correction factor determined. If residual error for the regression model continues to remain high, real--world DOE needs to be run to supplement the FEA simulation data to improve the model’s accuracy.
Conclusion
This paper discussed the intricacies associated with the design of cardiovascular catheters using Lasercut hypotubes for their optimal mechanical performance as desired by the physician community. Interrupted spiral pattern laser cut hypotube design allows for specifying a recipe of geometrical design inputs to control the mechanical performance outputs related to tension, torque and bending.The case study presented to detail the interrupted spiral pattern design methodology and optimization of multiple responses using Minitab’s RSM was able to identify a design using FEA simulation data with 20% error in tensile response,1% error in torque response and 35% in bending response.The high percentage error between the Minitab’s model was attributed to the high residual error in the model. This may be addressed- to improve the model’s predictability-by adding additional simulation data by running a full factorial DOE and identification of potential outliers due to sensitivity of FEA simulations compared to that of real-world data. A correction factor to neutralize the differences between the real-world data and the simulation data may be determined to account for the differences in variability of test methods, material models and the boundary conditions used by Minitab computations compared to the real-world.
Even with the large percentage error between the model’s prediction and simulation data for the chosen example design of the Lasercut hypotube, the methodology presented in the paper provided a detailed overview of modeling of Lasercut hypotube, selection of critical parameters for design, using FEA simulation data for conducting multiple response optimization using Minitab’s DOE and identification of optimized Lasercut Hypotube design for structural heart catheter without having to undergo cost prohibitive prototyping iterative process.
- Mueller RL, Sanborn TA (1995) The history of interventional cardiology: Cardiac catheterization, angioplasty,and related interventions. American Heart Journal 129:146-72.
- Reddy Bujuru K, Kandula R, Kiran Aedma S (2023) Polymers Based Catheters Design. International Journal of Science and Research (IJSR) 12: 1024-31.
- Ali A, Sakes A, Arkenbout EA, Henselmans P, van Starkenburg R, Szili-Torok T, Breedveld P (2019) Catheter steering in interventional cardiology: Mechanical analysis and novel solution. Proceedings of the Institution of Mechanical Engineers, Part H: Journal of Engineering in Medicine 233: 1207-18.
- Filgueiras-Rama D, Estrada A, Shachar J, Castrejón S,Doiny D et al. (2013) Remote Magnetic Navigation for Accurate,Real-time Catheter Positioning and Ablation in Cardiac Electrophysiology Procedures. Journal of Visualized Experiments 74.
- Maura Leahy (2006) Designing Hypotube Based Catheter Shafts. Medical Device + Pharmaceutical Technology 1-4.
- Figulla HR, Webb JG, Lauten A, Feldman T (2016) The transcatheter valve technology pipeline for treatment of adult valvular heart disease. European Heart Journal 37:2226-39.
- Liam Farrissey (2004) Metal Shafts: Designs To Meet The Required Performance. Www.Medicaldevicesonline.-Com 1-4.
- Inam H, Ali M, Arshad A (2023) Low Profiled Angiographic Catheter with Enhanced Pushability and Flexibility:A Novel Design, Fabrication, and in-Vitro Analysis. Proceedings of the 16th International Joint Conference on Biomedical Engineering Systems and Technologies 29-36.
- Sun W, Abad A, Sacks MS (2005) Simulated Bioprosthetic Heart Valve Deformation under Quasi-Static Loading.Journal of Biomechanical Engineering 127: 905-14.
- Sun W, Abad A, Sacks MS (2005) Simulated Bioprosthetic Heart Valve Deformation under Quasi-Static Loading.Journal of Biomechanical Engineering 127: 905-14.
- Joglekar AM, May AT (1987) Product excellence through design of experiments. Cereal Foods World 32: 857.
- Atkinson AC, Donev AN (1992) Optimum experimental designs 5.
- Hasniyati MR, Zuhailawati H, Ramakrishnan S (2016) A Statistical Prediction of Multiple Responses Using Overlaid Contour Plot on Hydroxyapatite Coated Magnesium via Cold Spray Deposition. Procedia Chemistry 19: 181-8.
FIGURE 1
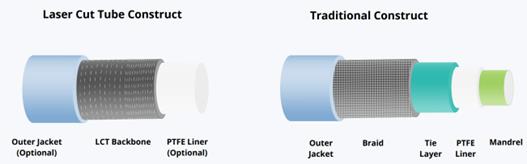
Figure 1: Braid Based vs Lasercut Hypotube Based Catheter Construction
FIGURE 2
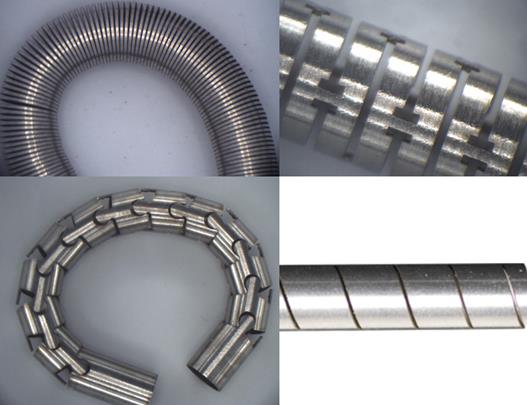
Figure 2: Common Lasercut Patterns
FIGURE 3
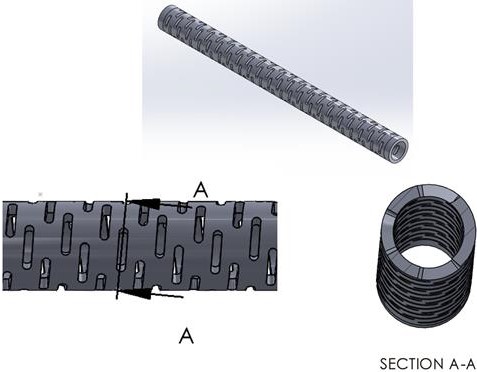
Figure 3: CAD Model- Interrupted Spiral Lasercut Pattern
FIGURE 4
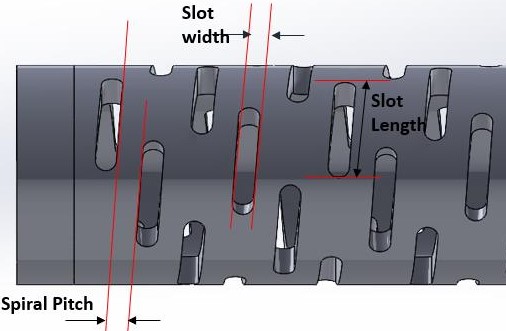
Figure 4: Critical Parameters Definition- Interrupted Spiral Lasercut Pattern
FIGURE 5
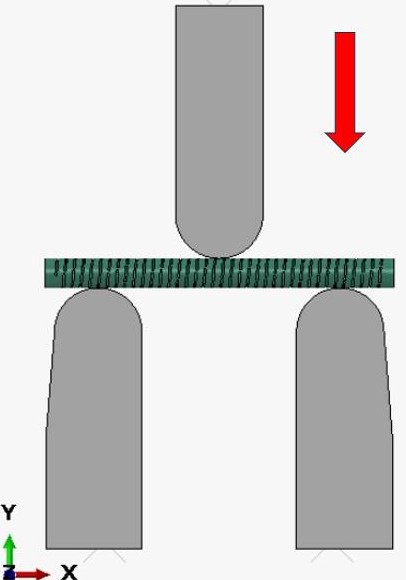
Figure 5: Test Setup-3pt Bend Test
FIGURE 6
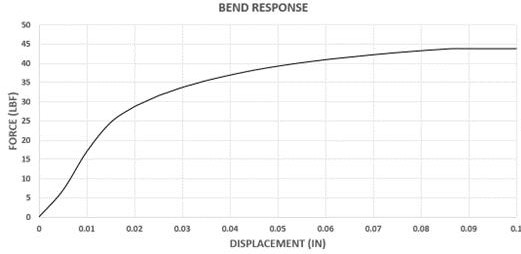
Figure 6: Force vs Displacement Curve- 3Pt Bend Test
FIGURE 7
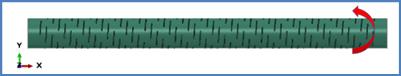
Figure 7: Test Setup-Torsion Test
FIGURE 8
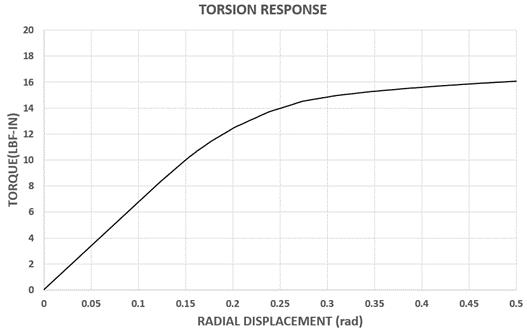
Figure 8: Torque vs Radial Displacement Curve- Torsion Test
FIGURE 9
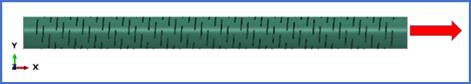
Figure 9:Test Setup-Tensile Test
FIGURE 10
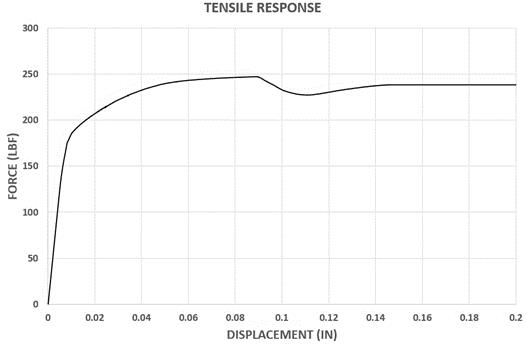
Figure 10: Force vs Displacement Curve- Tensile Test
FIGURE 11
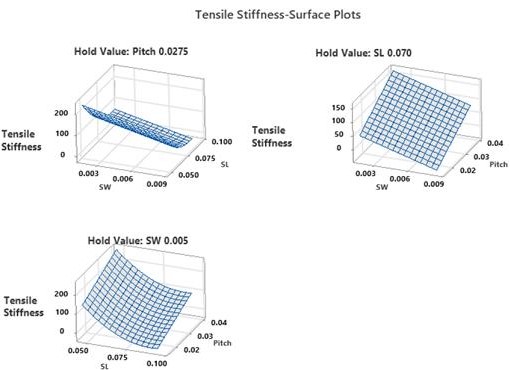
Figure 11: 3D Surface Plots- Tensile Stiffness
FIGURE 12
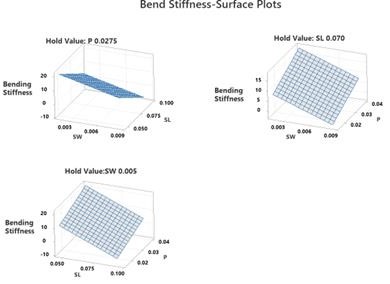
Figure 12: 3D Surface Plots- Bend Stiffness
FIGURE 13
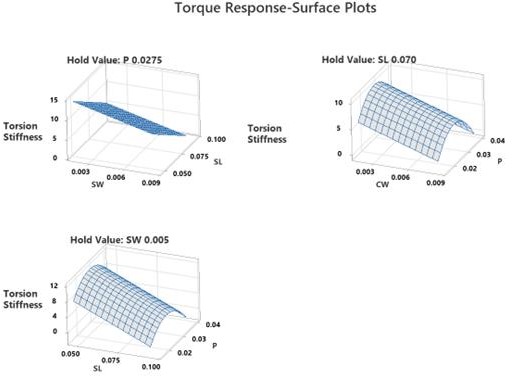
Figure 13: 3D Surface Plots- Torsional Stiffness
FIGURE 14
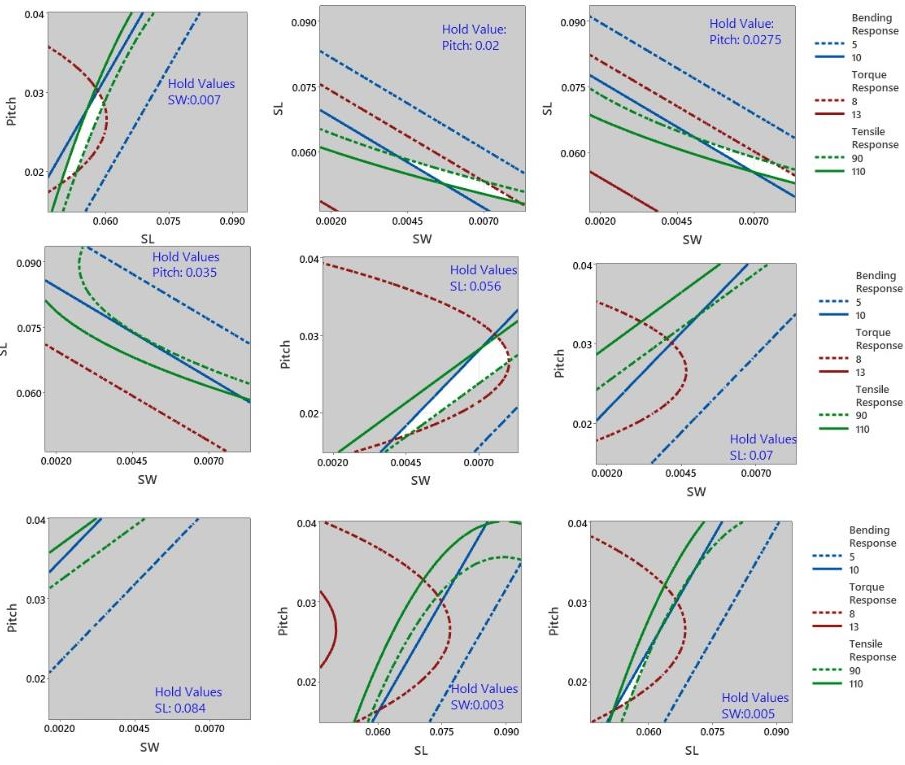
Figure 14: Overlaid Contour Plot Matrix
FIGURE 15
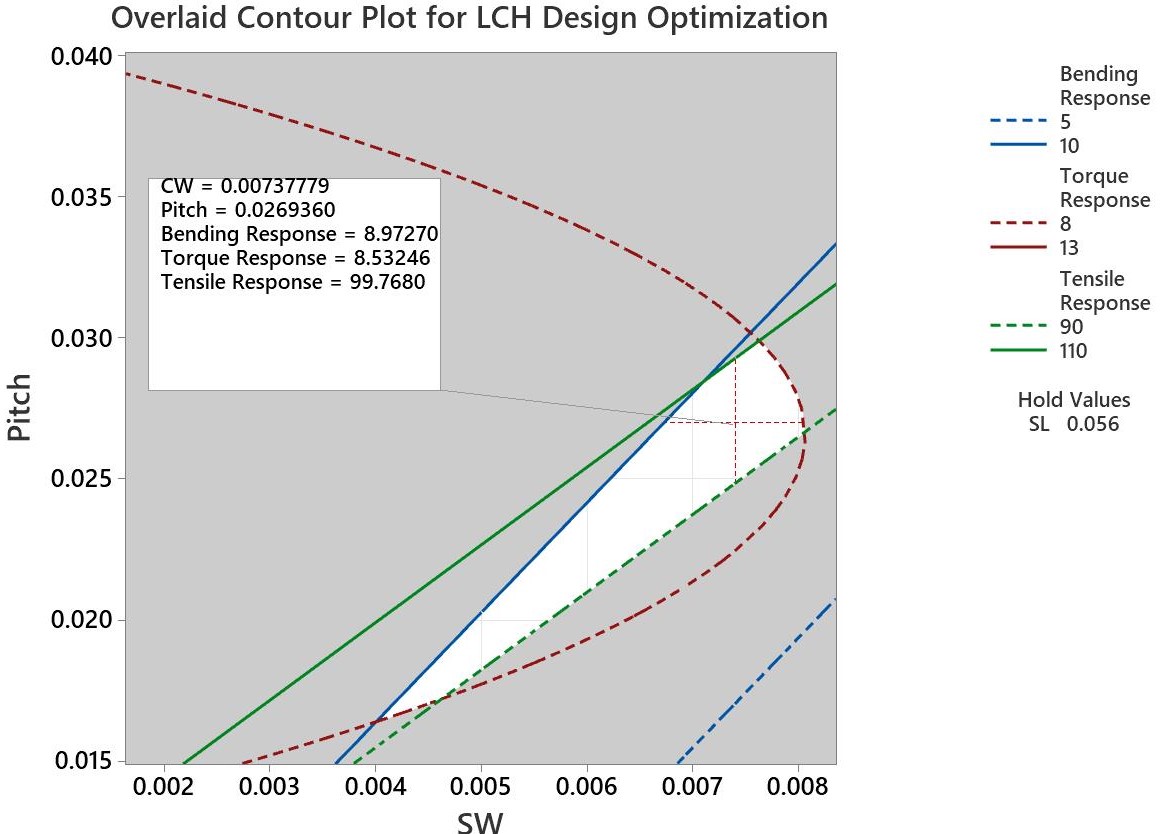
Figure 15: Overlaid Contour Plot- Pitch vs SW
Tables at a glance
Figures at a glance